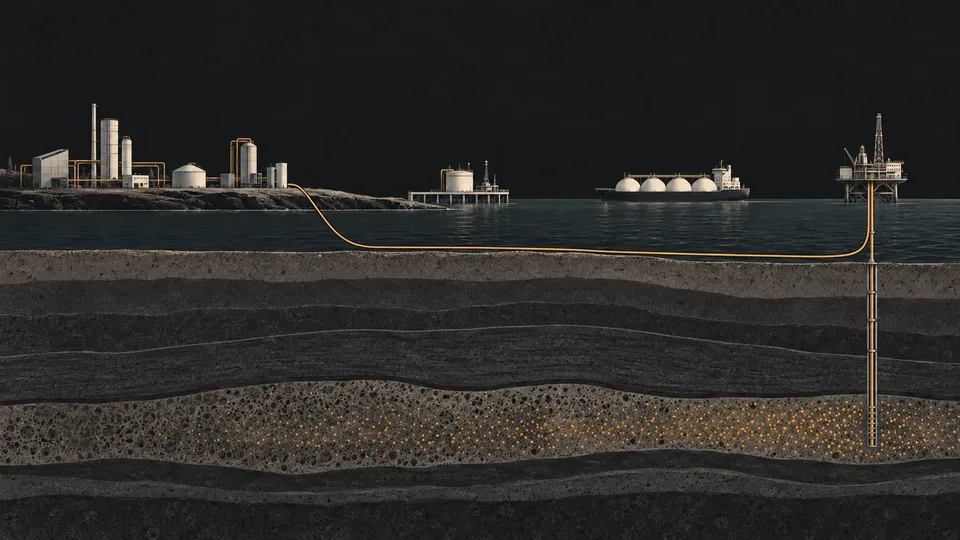
Carbon capture and storage (CCS) has passed the milestone of 100 operating commercial projects. The next challenge is not simply building more capture equipment. The Global CCS Institute launched Global Status of CCS 2026 on October 20 under the theme Sustaining Global Progress. Its findings highlight shared transport and storage, predictable revenue and risk allocation.
Separate project counts, capacity and stored volumes
As of July 31, 2026, the report tracks 832 commercial CCS projects: 113 operating, 59 under construction and 660 in development. These are not 832 capture plants. The list includes 266 dedicated CO₂ transport and storage projects, about 32% of the total. [Report, pp. 7–9]
- Operating capture capacity is 68 million tonnes per annum (Mtpa), not the amount actually captured during the year.
- Another 56 Mtpa is under construction. Adding both figures gives about 124 Mtpa if all that capacity enters service, roughly 82% above today’s level. This is neither completed growth nor a guaranteed schedule.
- The full project pipeline totals 522 Mtpa of capture capacity, including plans that are not operating.
- More than 400 million tonnes have been captured and permanently stored since 1996. That cumulative figure is not an annual capacity measure.
Compared with the 2025 edition, project numbers rose about 13%, but total capture capacity grew only about 2%. The report links the difference to smaller new projects, averaging around 0.5 Mtpa, and additional transport and storage projects without capture capacity. Counts and capacity tell different growth stories.
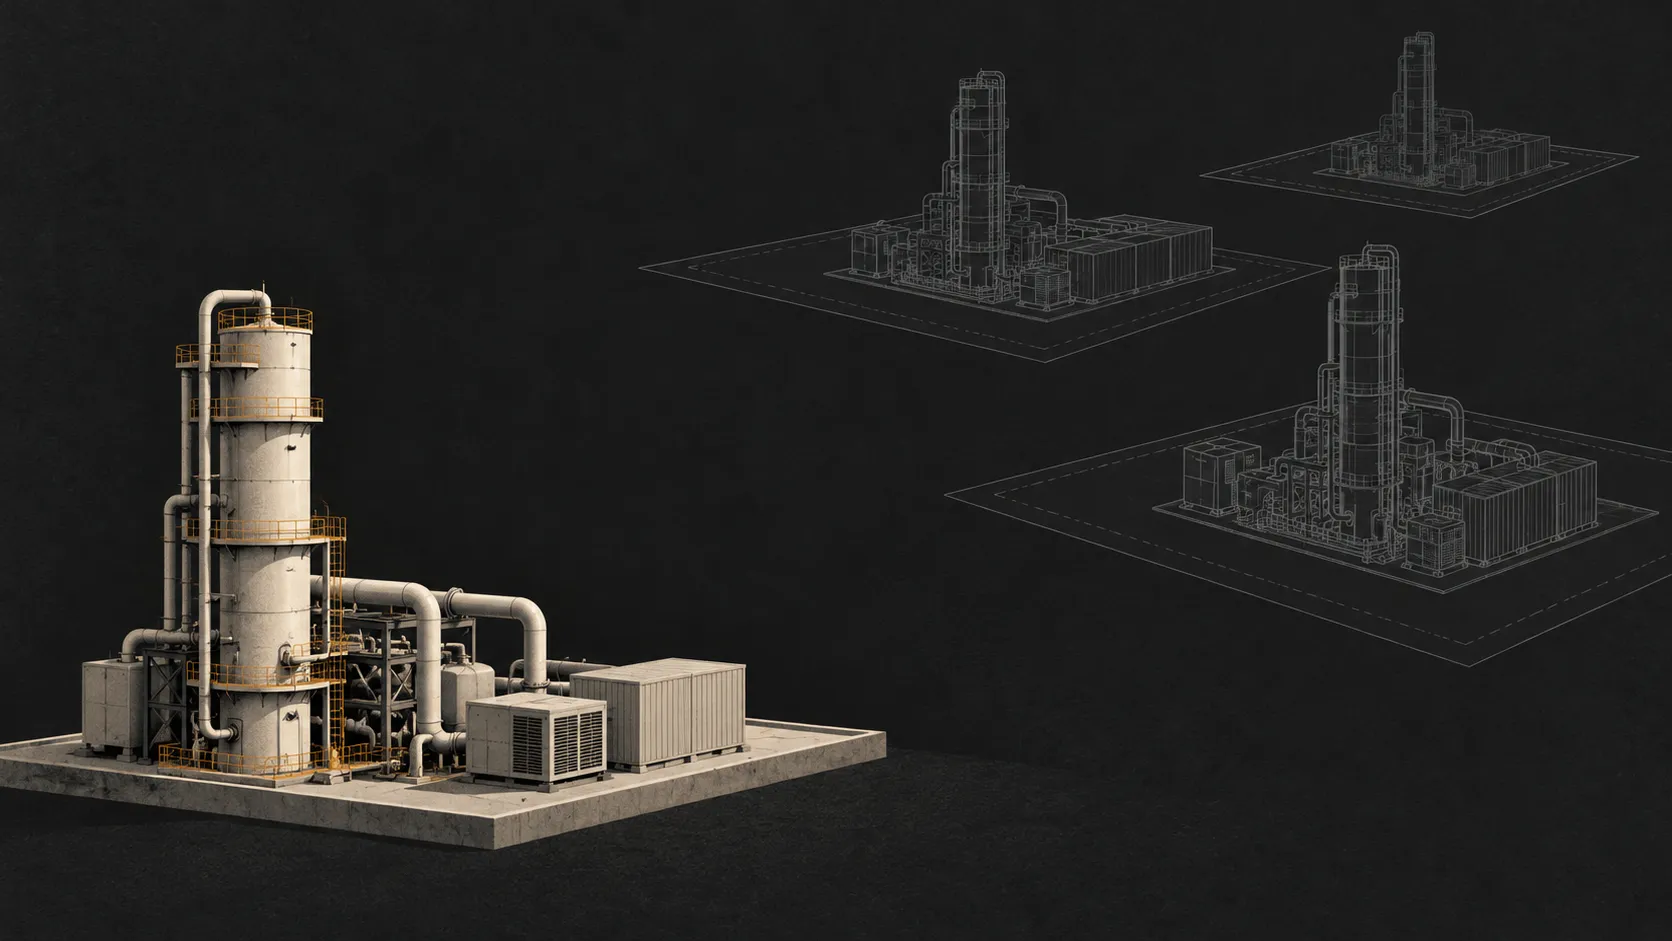
Question 1: Who connects capture equipment to usable storage services?
The sector mix is changing. Natural gas processing and liquefied natural gas (LNG) still lead operating capture capacity, at 42 Mtpa. Power generation and heat lead the full pipeline at 160 Mtpa, of which about 155 Mtpa is not yet operating. Hydrogen, ammonia and fertilizer total 103 Mtpa. These figures describe the project portfolio, not guaranteed future sales. [p. 10]
Shared networks can reduce the need for each emitter to develop its own complete transport and storage system. Europe has 15 operating projects and 21 under construction. The report points to Northern Lights, cross-border cooperation and CO₂ shipping as examples of emerging connectivity. A memorandum, a storage permit and an operating service accepting CO₂ remain different stages. [pp. 22–24]
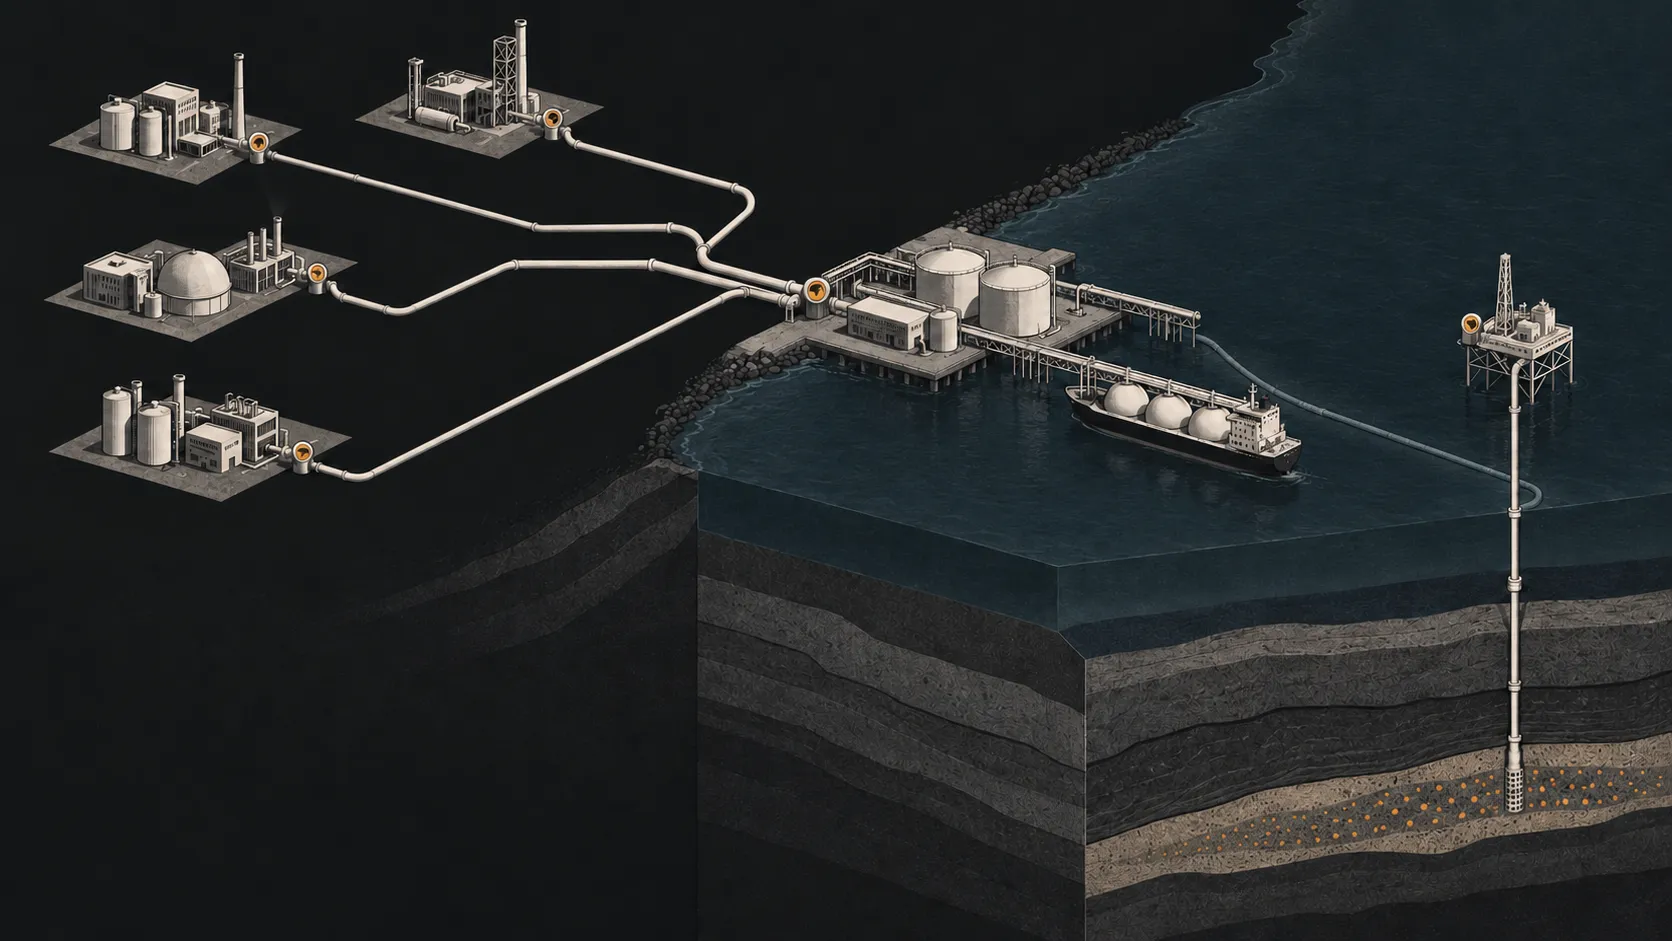
Question 2: When does a policy promise become calculable revenue?
Canada has extended the full-rate period for the ordinary CCUS investment tax credit through the end of 2035; rates are halved for 2036–2040. The scheme does not simply end in 2035. Eligible non-DAC capture equipment receives a 50% rate, while transport and storage equipment receives 37.5%. A separate 2026 proposal would make qualifying EOR eligible at half the ordinary rates—for example, 25% for that capture equipment—with permanent-storage and other conditions. The official statute consolidated through September 30 still excludes EOR, while July documents describe draft legislation. The report’s shorthand is not evidence that EOR already receives 50%. [Income Tax Act s.127.44, current to September 30, 2026] [Spring 2026 proposal] [July draft consultation]
Japan’s law and support proposals also need to be separated. Its CCS Business Act took full effect on May 22, 2026. The report describes support for cost differences in pipeline-based CCS as a policy under consideration. Its 15-year period and advance support of up to 75% of construction costs are design features, not grants already secured by every project. Shipping projects face separate cost and support discussions. [Japanese government] [Report, p. 46]
Japan is also pursuing shared liquefaction, temporary storage and loading facilities to reduce shipping costs. In June 2026, JOGMEC selected candidate design teams for six emitter clusters. These are not six operating storage sites. The nine Advanced CCS Projects, six shipping clusters and the government’s early-2030s annual goal of 6–12 million tonnes, as described in the 2026 report, are different measures. [JOGMEC, June 24, 2026] [Report p. 47: early-2030s goal]
Question 3: How does engineering progress become a financeable value chain?
Large Gulf projects and Asia-Pacific cross-border plans both show the distance between announcement and operation. Qatar’s Ras Laffan project is approximately 4.3 Mtpa. Worley’s 2026 engineering announcement describes capacity once the project is operational, not current performance. [Worley, February 10, 2026]
The report’s Asia-Pacific and India chapter identifies unresolved questions around liability transfer, long-term stewardship, crediting and commercial risk. China’s oil and gas sector plan sets a target of 10 million tonnes of annual CO₂ injection by 2030. That is a sector-specific policy goal, not achieved storage. It also does not establish a ready-to-use cross-border model for every country. [p. 37] [Official report page] [Report p. 43: China oil and gas target]
Our view: Taiwan should ask more than how many projects exist
The following is our reading, not an official conclusion of the report or a government. For Taiwan, a more useful comparison is a complete capture, transport and storage chain that can operate continuously and be verified. A global project count is not an equipment shopping list.
- Define service boundaries: who is responsible for CO₂ specifications, custody-transfer measurement and off-specification deliveries?
- Allocate timing risk: if capture equipment is ready before storage services, who bears the cost of downtime?
- Specify revenue: what conditions, duration and change risks apply to subsidies, carbon prices or recognized reductions?
- Track verifiable results: report capacity, actual capture, delivery, injection and monitoring separately rather than treating them as interchangeable.
The 113 operating projects show expanding deployment, not that every business-model problem has been solved. Read beyond the project list: does each new development have usable storage, enforceable contracts and revenue sufficient for sustained operation?
What remains uncertain
Development projects may not all be completed. Planned capacity is not actual emissions reduction, and proposed policies are not enacted entitlements. This article uses the July 31, 2026 project snapshot while treating legal and engineering developments according to their own dates and conditions.
Leave a comment
Comments are reviewed before publication. Email is private and used only when contact is necessary. Privacy notice