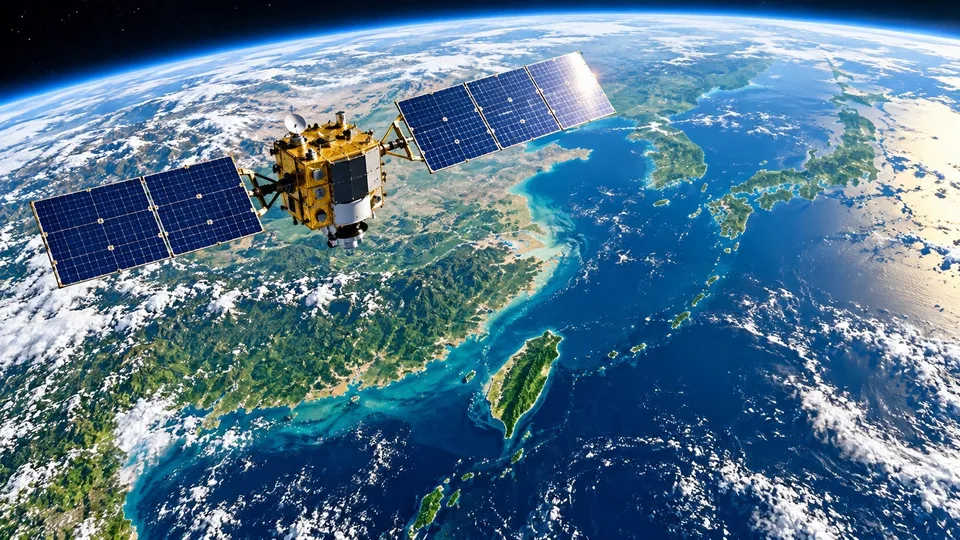
On October 22, 2026, the Allen Institute for AI (Ai2), a US non-profit research institute, released the satellite embedding model OlmoEarth v1.3. The release has three parts: the OlmoEarth v1.3 Base model, precomputed annual embeddings for the whole planet, and the OlmoEarth Embeddings Explorer, a browser tool that needs no sign-in. The model weights, pretraining data and code are open under the OlmoEarth Artifact License.
What a satellite embedding is
Satellites photograph the same place every few days, building up a large stack of images over a year. To tell whether a plot is a rice paddy, a forest or a mine, the usual approach has been to train a separate model for each task, download and store large amounts of imagery, and run it on GPUs.
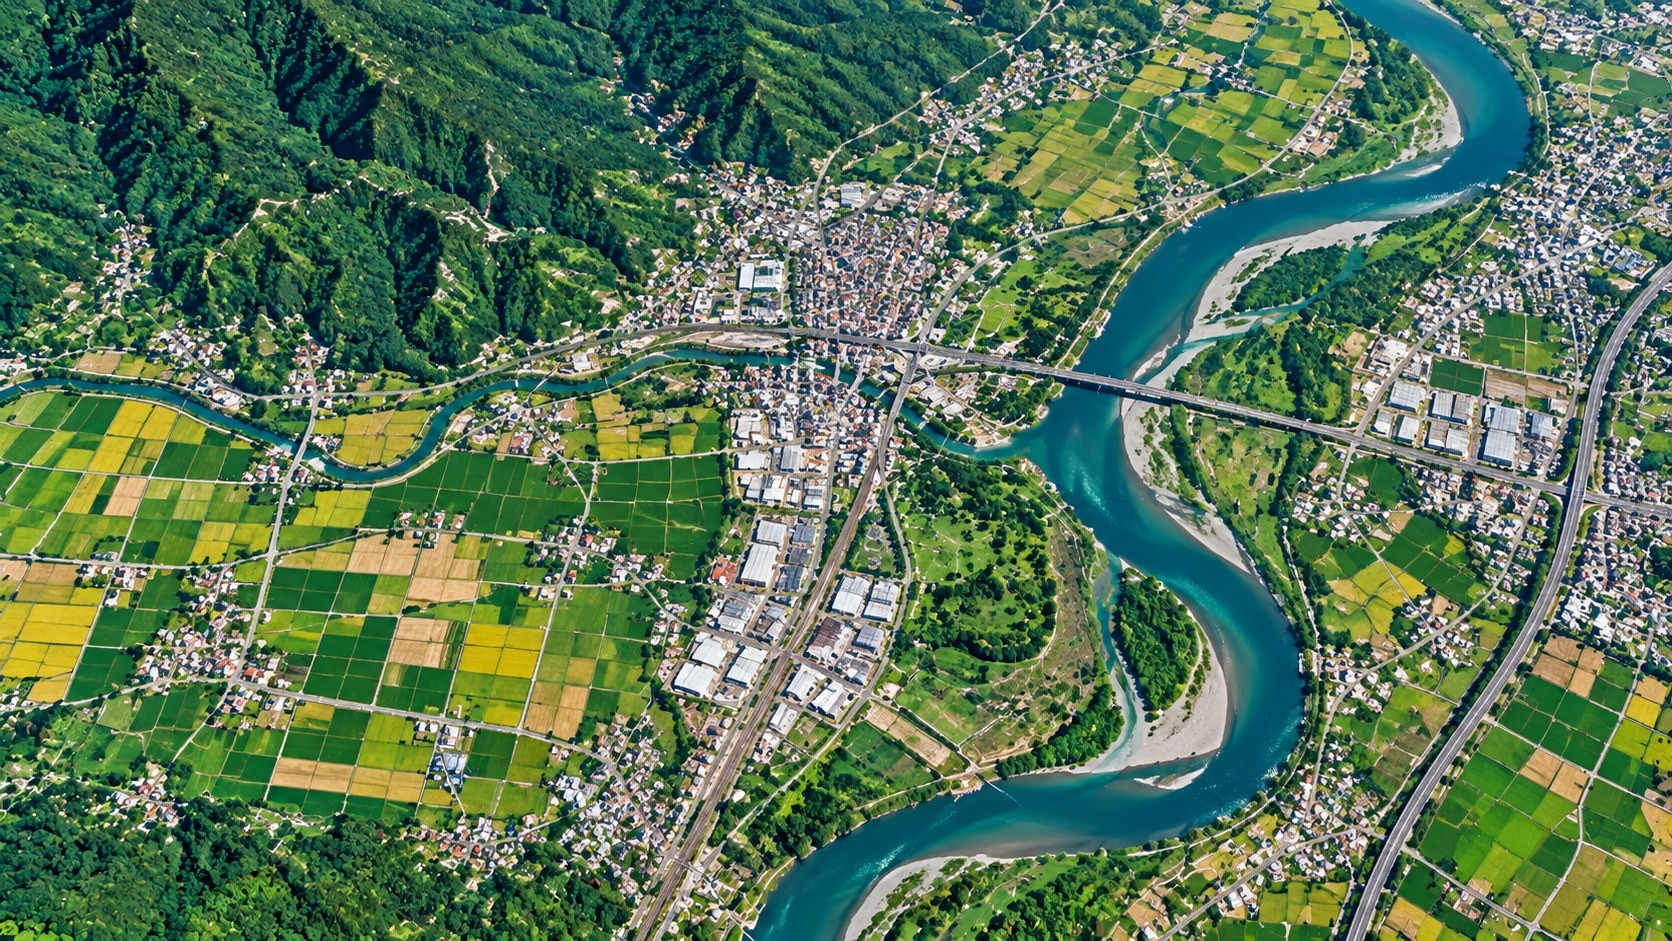
An embedding takes a different route. A large model first "reads" the imagery, then compresses a whole year of features at each location into a list of numbers. OlmoEarth v1.3 reads a year of Sentinel-1 radar and Sentinel-2 and Landsat multispectral imagery and produces a vector of 128 numbers for every 10-metre pixel on Earth. The first 64 numbers also work on their own as a smaller version. In the architecture, a vision transformer reads the satellite data, an Attention Pooler pools it into one vector per patch of land, and a linear layer reduces it to 128 numbers.
Think of the vector as a summary of a piece of land. Places with similar surface conditions have similar vectors, and a big difference between one place's vectors in two years means the surface has changed. With ready-made global embeddings, a crop map, land-cover map or change analysis becomes a light task: train a small classifier on top and run it on your own computer.
Coverage and benchmark results
The embeddings are hosted on Source Cooperative at 10-metre resolution, about 150 TB per year, covering land and adjacent coastal waters. At launch, 2023, 2024 and 2025 are global, while 2017 to 2022 cover select countries. Each 20-kilometre tile and year comes with a provenance table listing the Sentinel-1, Sentinel-2 and Landsat scenes the model read, so any pixel can be traced back to its source imagery.

Ai2 compared OlmoEarth v1.3 with Google DeepMind's AlphaEarth Foundations and Tessera v2 across 27 evaluations on six continents. The 128-dimensional version scored highest on 20 of them, and the 64-dimensional version led on 18. Ai2 also introduced PLANTEUR, a new crop-type benchmark for tropical farming. On cost, v1.3 used 53% of the computing time of v1.2 and 18% of v1, with 50% and 22% of their carbon emissions. Ai2 estimates that reproducing the final pretraining run of the Base model would cost about US$2,720 of rented H100 time.
Ai2's examples include classifying smallholder crops in Kenya, detecting brick kilns west of Dhaka, assessing fire damage in Indonesia and tracking gold mining in the Peruvian Amazon.
Seeing land change with embeddings: a gold-mining area in Peru
In Peru's Madre de Dios region, illegal gold mining around La Pampa peaked in 2017 and 2018. According to the MAAP monitoring programme of Amazon Conservation, it cleared more than 1,200 hectares of forest in the buffer zone of the Tambopata National Reserve. In February 2019, Peru's Operation Mercurio shut most of it down.
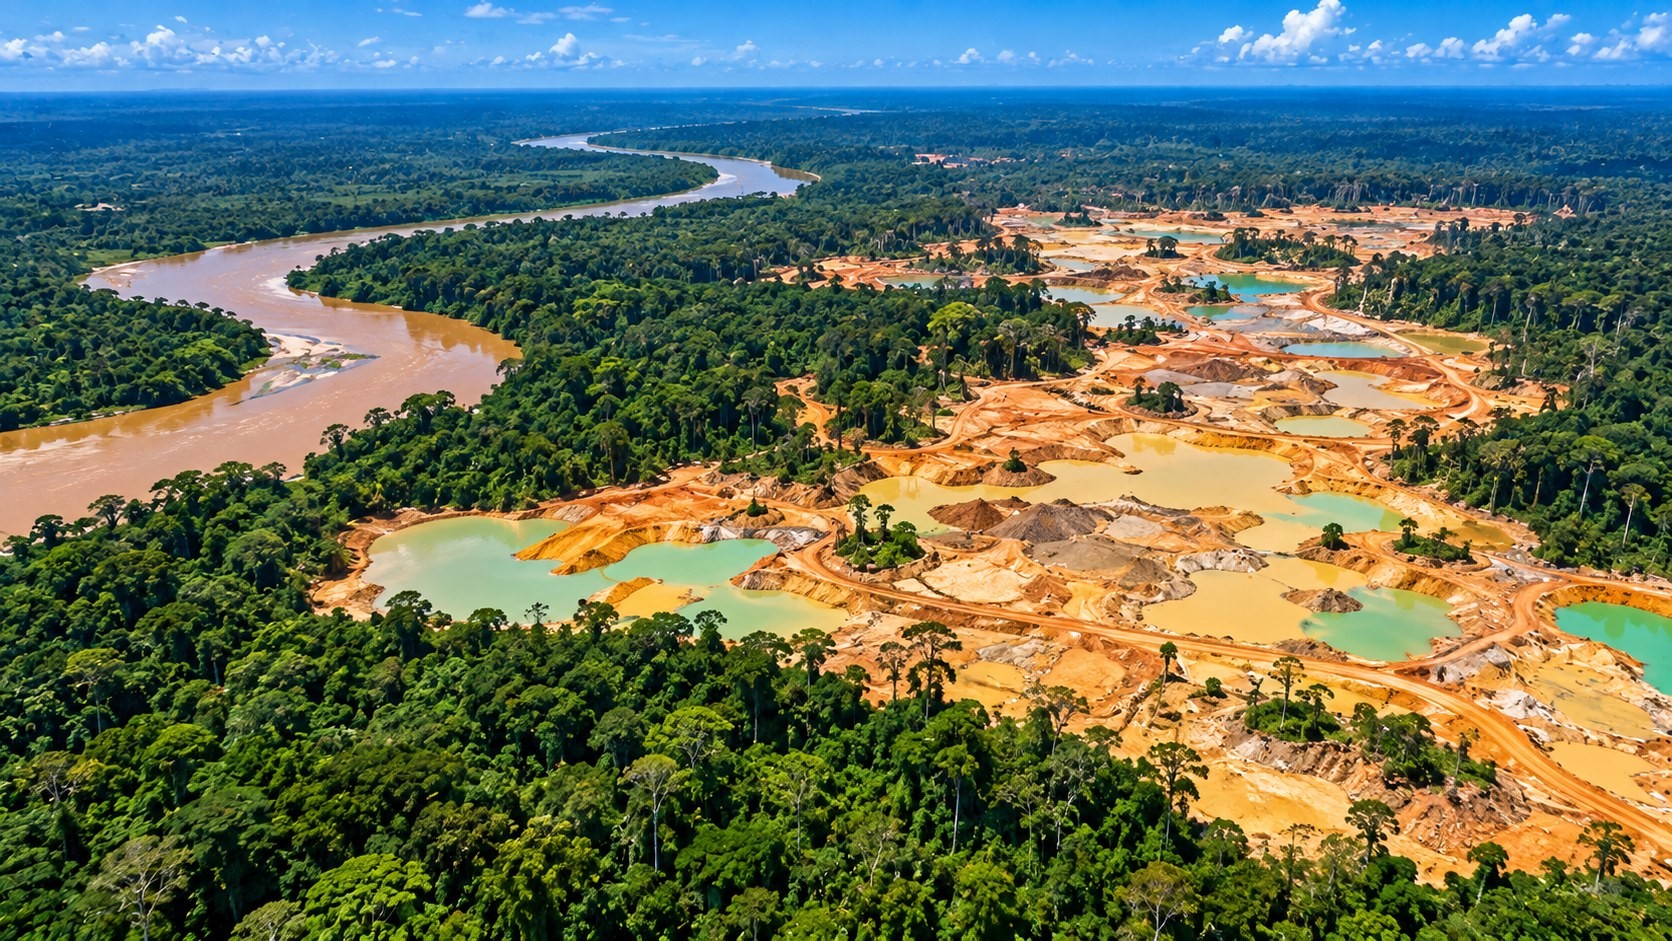
Ai2 compared each pixel's vector across years, with no model training required. The 2017–2020 comparison shows mining spreading to the southeast. In the 2020–2025 comparison that corner has gone quiet, and the change sits in the older mining zone to the west, partly regrowth and partly renewed digging. The Associated Press reported in August 2026 that Peru sent navy patrols back after prosecutors found mining had crossed into the reserve itself.
The Embeddings Explorer renders the embeddings as a false-colour map of the planet. Users can switch years to see change, pull up Sentinel-2 imagery to check the real scene, click a place to find similar places, or drop a few labelled points to train a small classifier on the spot and export the result as a GeoTIFF, all without a GPU.
How this can support forest carbon monitoring
Under the IPCC Guidelines for National Greenhouse Gas Inventories, emissions and removals from land are estimated by multiplying "activity data" by "factors." Activity data are the areas of each land type and how they change, such as forest converted to mining or farmland. Factors are the change in carbon per hectare.
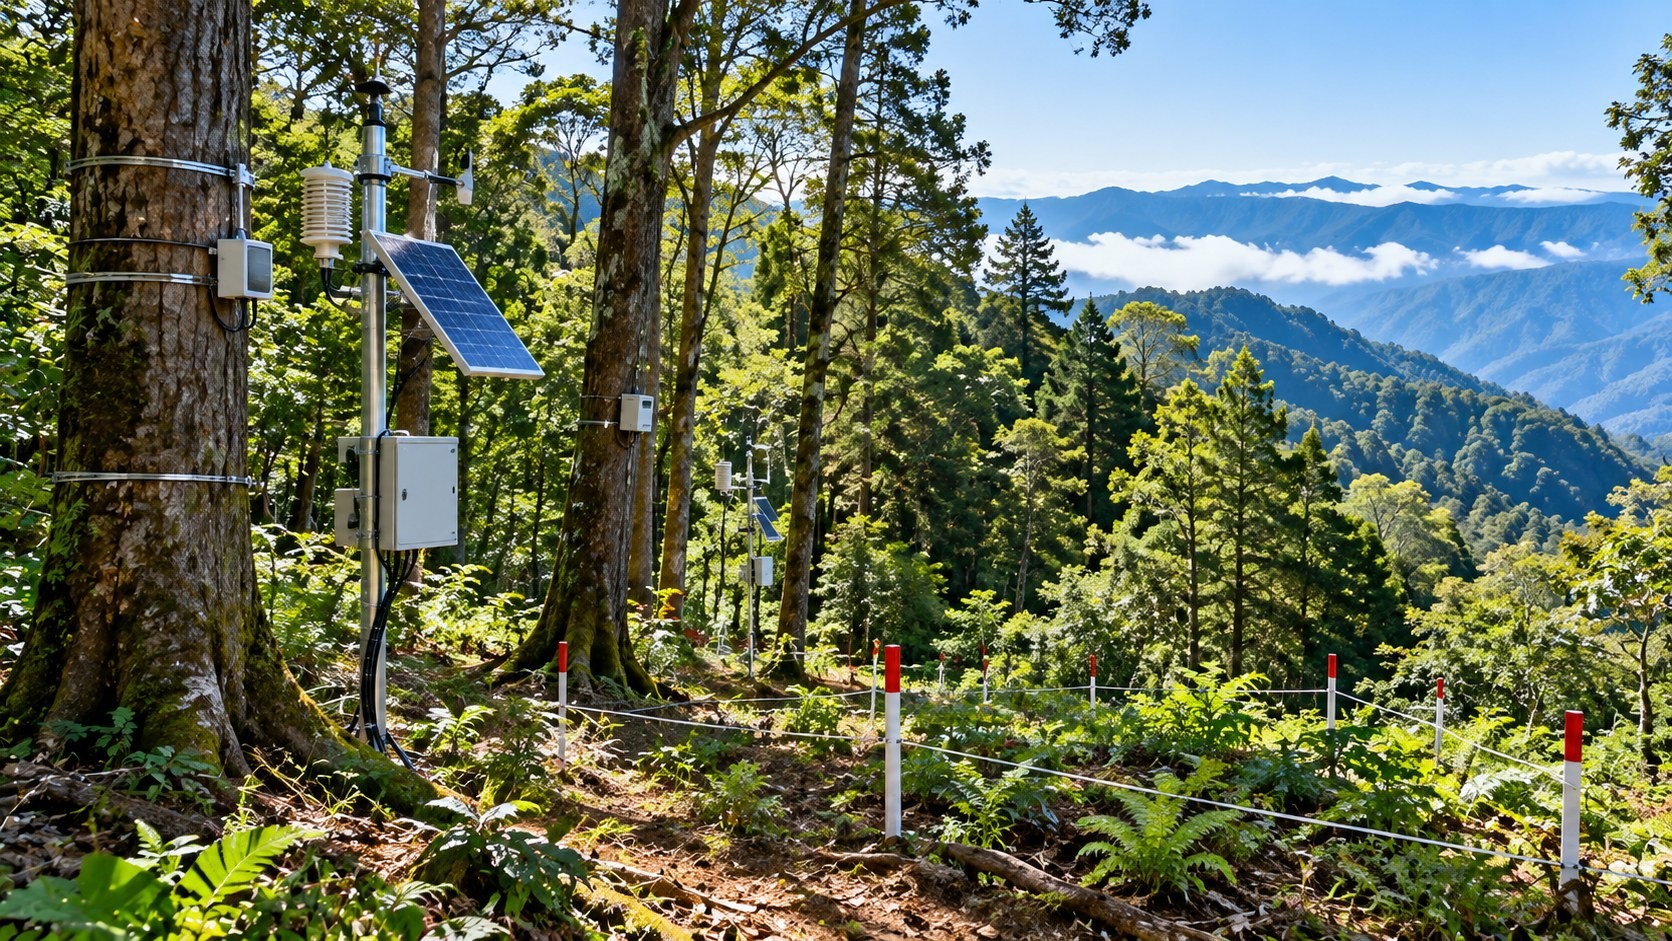
Embeddings help on the activity-data side. A classifier trained on a small set of labelled points can map forest extent year by year, and comparing years shows where and how much forest was lost or recovered. Carbon per hectare still has to come from field plots or other data; the embeddings themselves contain no carbon figures. Because the 2017–2022 embeddings cover only select countries, check that your area is covered before running long-term comparisons.
The same kind of analysis is reaching commercial GIS software. ArcGIS Pro 3.7, released by Esri in May 2026, added an "Embeddings Based Analysis" toolset to its GeoAI toolbox, including Generate Embeddings Using AI Models, Find Similar Features Using Embeddings, Merge Embeddings and Extract Embeddings To Fields, for tasks such as similarity search.
Possible directions for Taiwan
- Try the Explorer on Taiwan first: 2023 to 2025 are global, so recent land change in Taiwan, such as hillside development or solar farm sites, can be viewed directly to judge whether deeper analysis is worthwhile.
- Combine with existing surveys: Taiwan's national land-use survey and forest resource inventory can supply labels for training classifiers, while embeddings extend the analysis island-wide and year by year.
- Use in monitoring and verification for carbon credit projects: forest carbon projects need regular checks on forest extent. Embeddings and their provenance tables can provide traceable satellite evidence. See our article "Can digital MRV deliver carbon credits faster? Buyers should ask about data, verification and responsibility."
- Check the licence: the data are released under the OlmoEarth Artifact License, so review its terms before using them in a commercial service.
Sources
- Ai2, "OlmoEarth v1.3: State-of-the-art embeddings for the whole planet," 2026-10-22: https://allenai.org/blog/olmoearth-v1-3
- Source Cooperative, OlmoEarth v1.3 Embeddings: https://source.coop/olmoearth/olmoearth-v1-3-embeddings
- Esri, "An overview of the Embeddings Based Analysis toolset" (ArcGIS Pro 3.7 documentation): https://doc.esri.com/en/arcgis-pro/latest/tool-reference/geoai/an-overview-of-the-embeddings-based-analysis-toolset.html
- IPCC, 2006 IPCC Guidelines for National Greenhouse Gas Inventories, Volume 4: Agriculture, Forestry and Other Land Use: https://www.ipcc-nggip.iges.or.jp/public/2006gl/vol4.html
Leave a comment
Comments are reviewed before publication. Email is private and used only when contact is necessary. Privacy notice