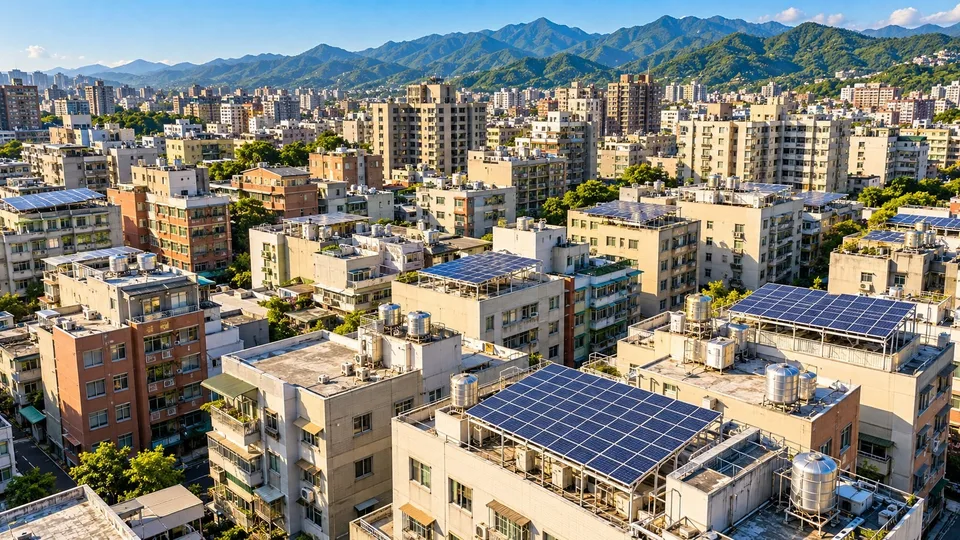
On August 7, 2026, the Center for GIS at Academia Sinica's Research Center for Humanities and Social Sciences (Sinica GIS Center) announced a "3D rooftop solar potential query service" built with Feng Chia University's Department of Urban Planning and Spatial Information, the Ministry of the Interior's National Land Surveying and Mapping Center (NLSC) and the Taiwanese 3D GIS company Zangshi Technology (藏識科技). Users type in a street address, the system locates that building in 3D, and it shows the roof's effective installable area, estimated capacity, generation potential and estimated revenue. The service is free and needs no account. The first release covers Taichung only. At launch, the team said it expected to cover the six special municipalities by the end of August and then expand nationwide as data became ready.
To use it, open Academia Sinica's 3D spatiotemporal information platform (earth.rchss.sinica.edu.tw), choose "定位搜尋" (location search), then "建築光電潛力" (building solar potential), and enter an address. Turning on the "披覆" (drape) layer colours the 3D building by potential; darker colours mean higher potential.
Supporting the building solar rule that took effect in August
The "Standards for Installing Solar Power Generation Equipment on Buildings," set by the Ministry of the Interior with the Ministry of Economic Affairs, took effect on August 1, 2026. New buildings, extensions and rebuilds with a building area of 1,000 square metres or more must in principle install 1 kilowatt (kW) of solar capacity for every 20 square metres. A new factory with a 2,000-square-metre building area would therefore need about 100 kW in principle.
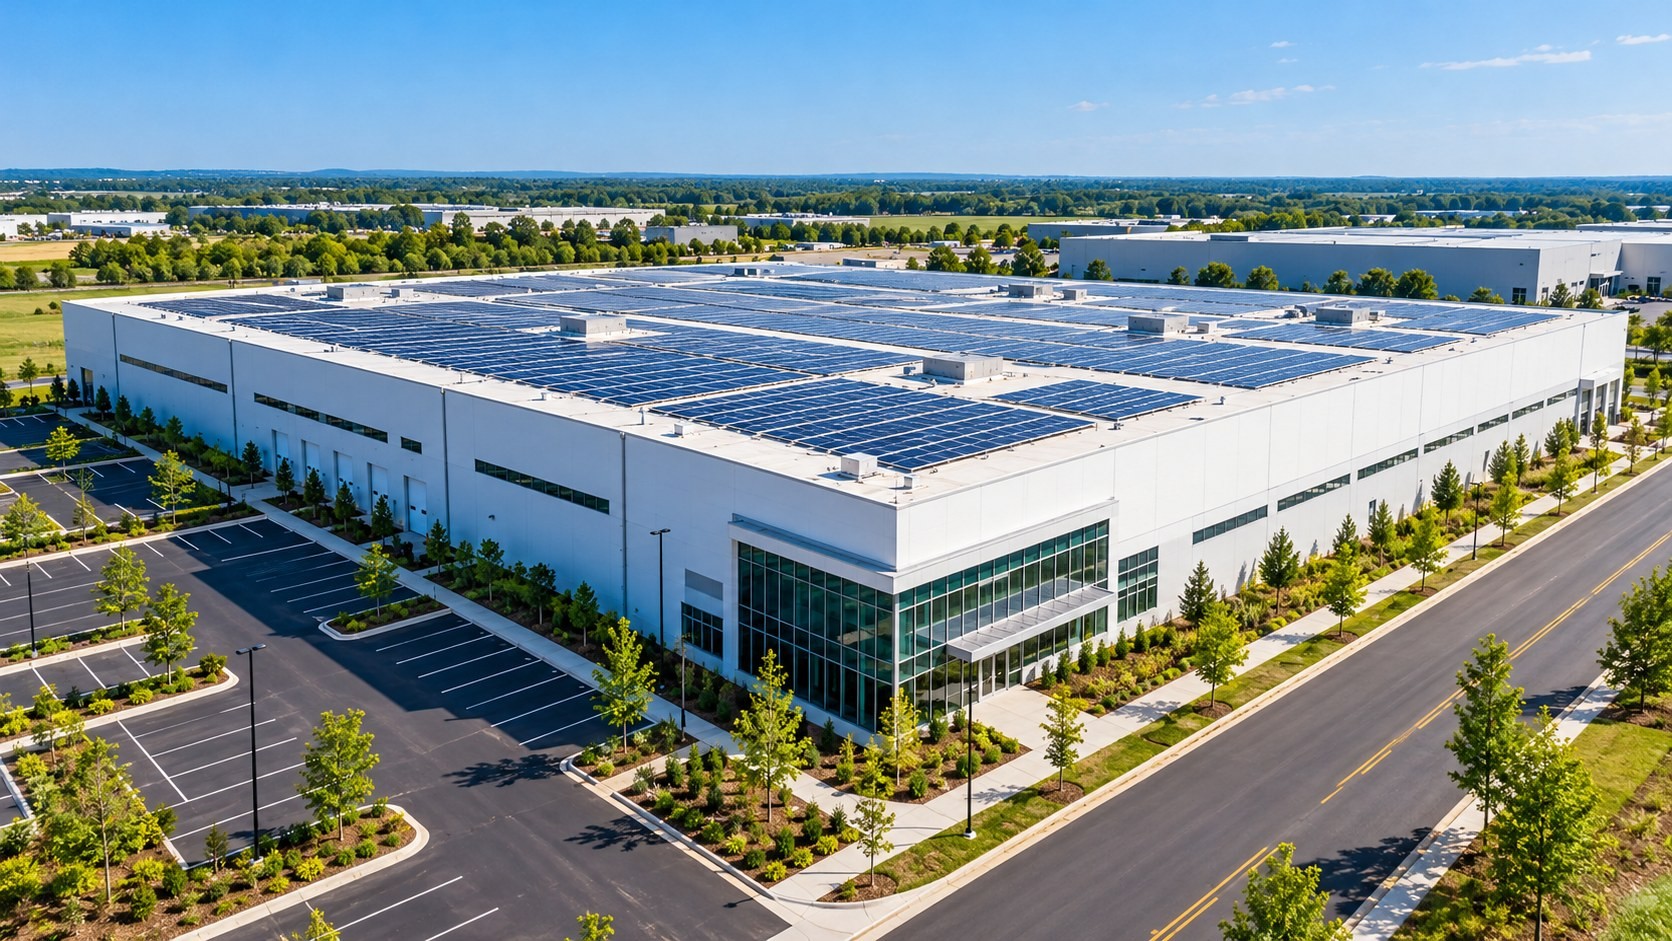
According to the Sinica GIS Center, the tool helps builders gauge installable capacity early in planning, lets solar developers screen roofs, and gives building owners a view of their own roof's potential.
The method comes from a Feng Chia University undergraduate project by Hsieh Chen-yuan, Lin Tzu-ting and Yeh Yu-chen, supervised by Associate Professor Hsu Yi-hsiang: "Power Plants on the Roof: An Urban Solar PV Potential Map Integrating DSM and Sunlight Simulation." It won first place in the university division of the 8th National Spatial Data GIS Competition, organized by the Taiwan Geographic Information Society, and originally studied industrial zones in Taichung. In the public version, NLSC supplies the national spatial data, the Feng Chia team built the rooftop sunlight and solar assessment model, and the Sinica GIS Center and Zangshi Technology built the 3D GIS interface.
From an address to a 3D building: the national base maps used
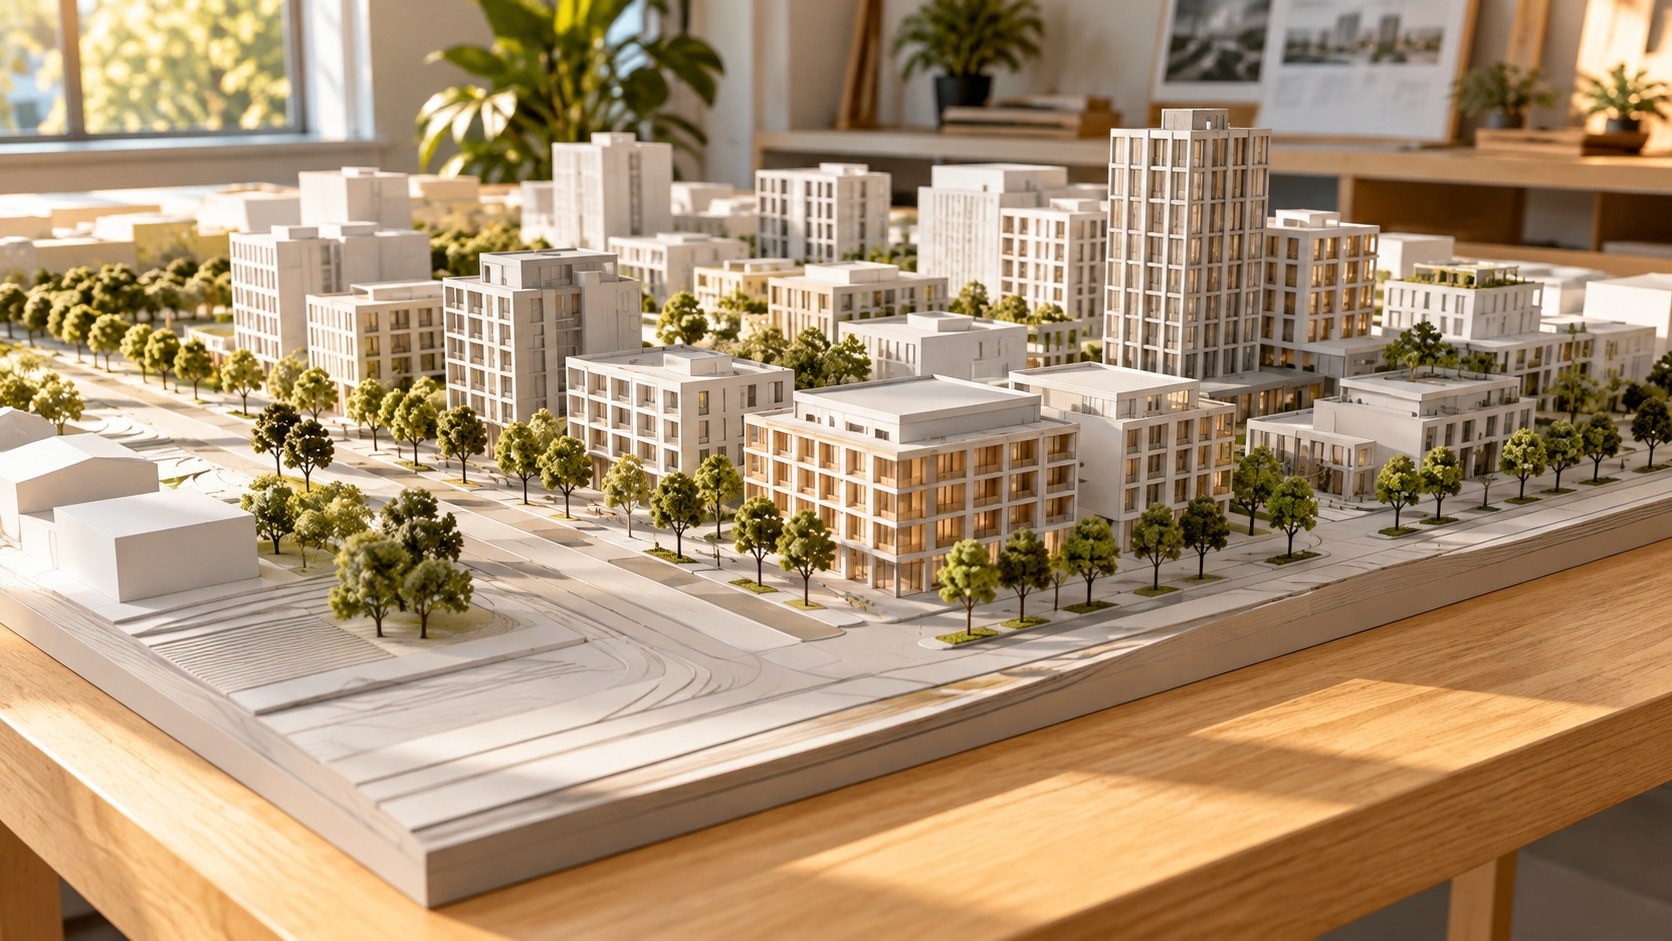
The system uses data from the Ministry of the Interior's "Multi-dimensional National Spatial Information Service Platform" and combines three national base maps:
- Digital elevation model (DEM): produced by the Department of Land Administration; it records the height of the bare ground.
- Building footprints from the Taiwan e-Map: produced by NLSC; the outline of each individual building.
- National land-use survey: the current use of each parcel, used to help screen whether installation is legally suitable.
A DEM describes only the ground, without houses or trees. Adding building heights to the footprints raises each building as a 3D block on the terrain, which fixes the position and height of every roof. The original student project used a digital surface model (DSM), which records the top surface including buildings and trees. The two are often used together.
How sunlight, shadows and solar radiation are calculated
How much solar energy a roof receives in a year depends mainly on three things: where the sun is in the sky, how much light is left after passing through the atmosphere, and whether the roof is shaded. Sinica says the model accounts for Taiwan's solar path and atmospheric transmittance, and computes terrain relief, absolute building height, and the shadows cast by neighbouring buildings and facilities at different times of day.
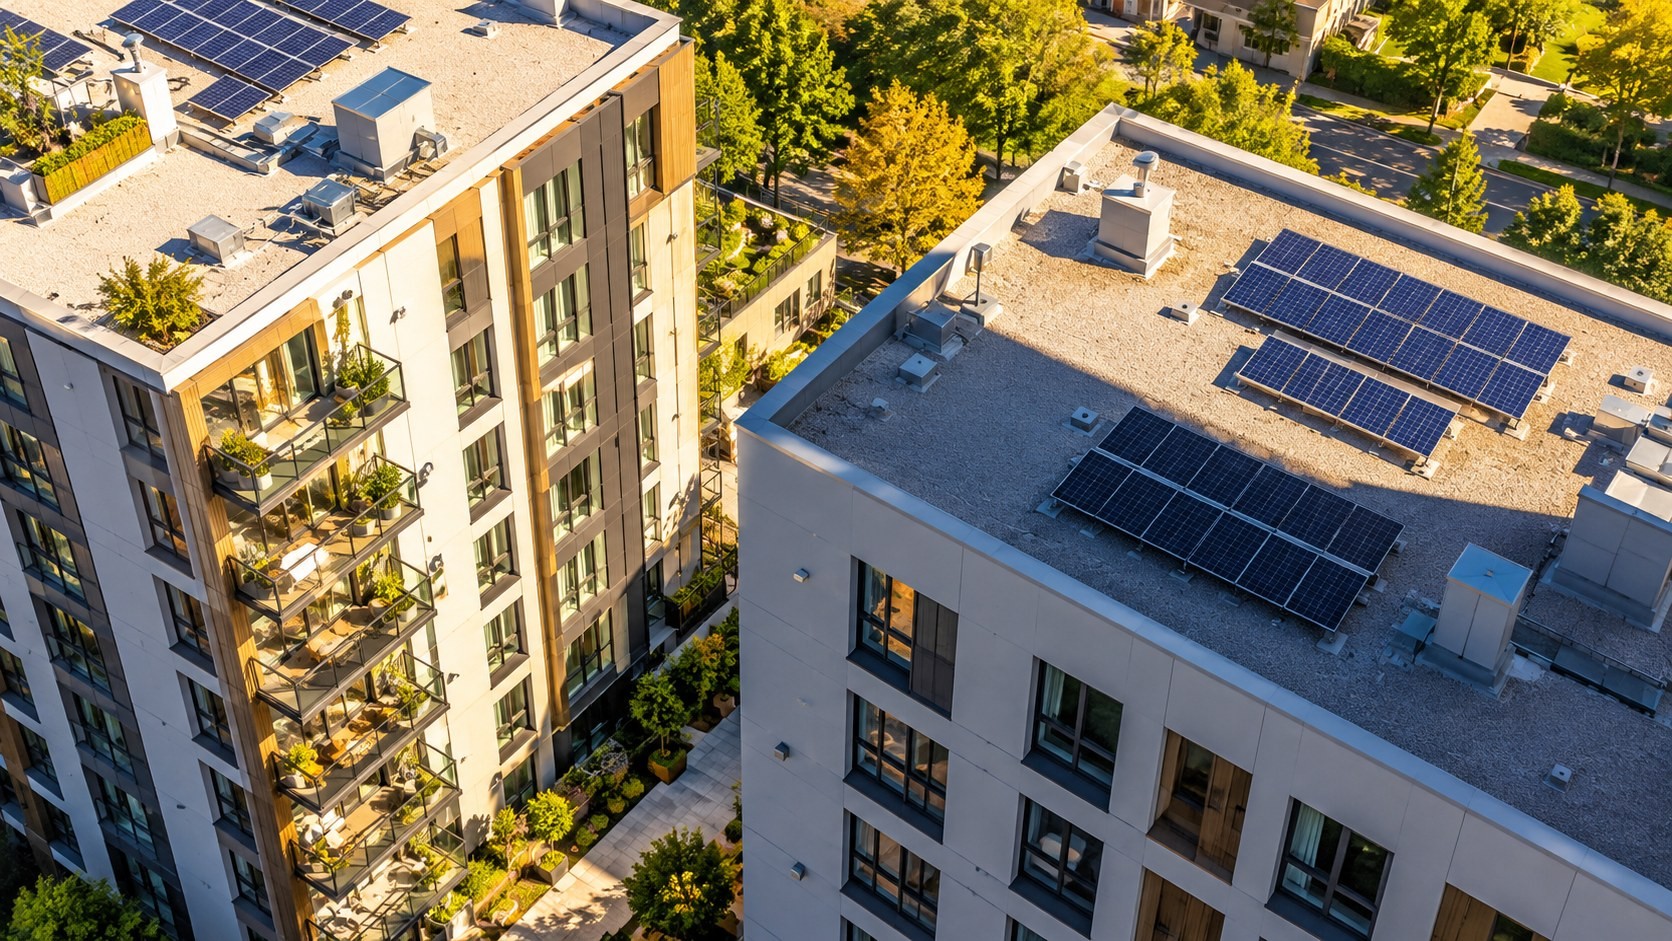
Simulations of this kind usually work as follows. The sun's elevation and azimuth are calculated from latitude, date and time. For many moments across the year, the model checks whether a taller building or hillside blocks the line from the sun to the roof. Blocked moments receive no direct sunlight. Adding up all moments gives the annual solar radiation for each part of the roof. This is why 3D building and terrain data are needed: a flat map cannot show what shades what.
From sunlight to capacity and revenue
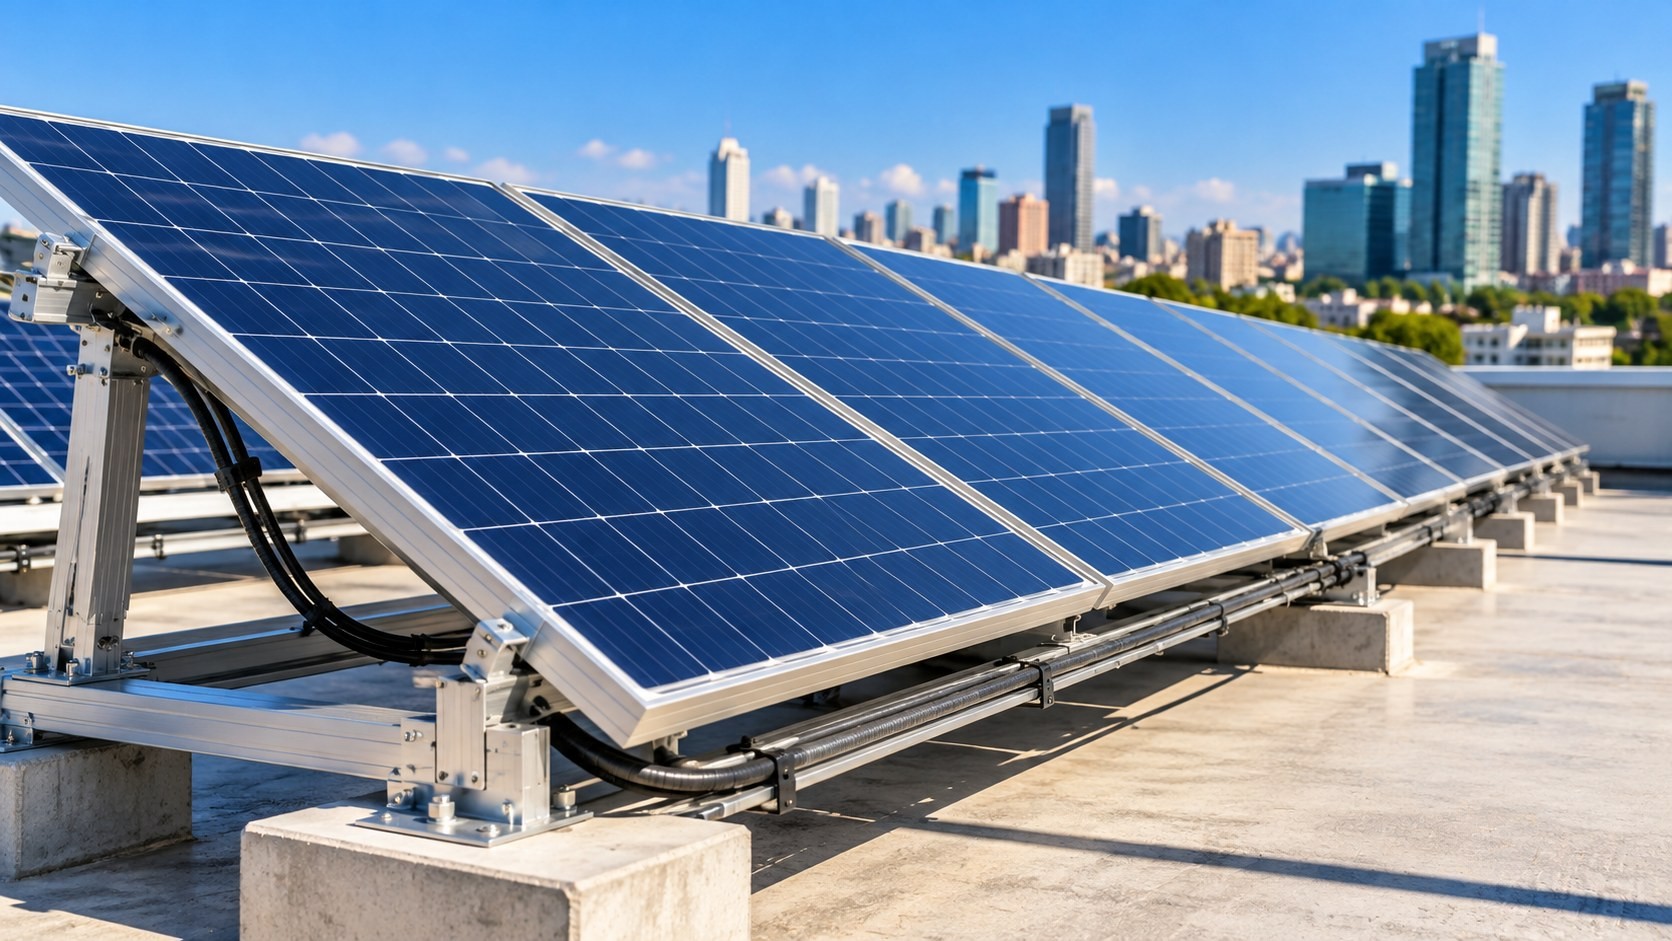
With radiation estimated, the model applies industry parameters: panel conversion efficiency, performance ratio (PR), a usable-roof coefficient and the latest feed-in tariff. From these it estimates the effective installable area, capacity, generation potential and financial return.
- Usable-roof coefficient: accounts for parts of a roof where panels cannot go, converting roof area into effective installable area.
- Performance ratio (PR): actual output divided by theoretical output, reflecting losses from wiring, inverters, temperature and so on.
- Feed-in tariff: the renewable electricity purchase rate announced by the Ministry of Economic Affairs, used to estimate sales income.
The results are a preliminary estimate. Actual capacity still depends on the building structure, rooftop equipment, firefighting space, electricity demand, grid connection and regulations, and requires on-site surveys and design by engineers, architects or solar installers. The results do not replace building permits, occupancy permits or other legal reviews.
Possible directions for Taiwan
- Check early for projects covered by the rule: new builds, extensions and rebuilds of 1,000 square metres or more can use the tool for a first estimate of rooftop capacity, then hand off to professionals for structural and grid assessment.
- Publish the model parameters: showing the PR, usable-roof coefficient and efficiency values in the interface would make it easier to compare results with on-site designs.
- Data update frequency matters: new buildings change the shading of nearby roofs, so how often footprints and building heights are updated affects how close results are to current conditions.
- Look at it alongside green power procurement: rooftop solar is one source of local supply. For companies weighing self-generation against buying green power, see our notes "Green Power Goes Hourly and Local: Notes from a Renewable Energy Forum."
Sources
- Center for GIS, RCHSS, Academia Sinica, "輸入門牌即可掌握太陽能板設置與發電潛力,國家底圖支援建築光電新制落實" (in Chinese), 2026-08-07: https://gis.rchss.sinica.edu.tw/pv_panel/
- Central News Agency, "產官學研推屋頂光電查詢系統 輸入門牌可測出潛力" (in Chinese), 2026-08-08: https://www.cna.com.tw/news/ahel/202608080066.aspx
- Feng Chia University, "內政部與中研院導入逢甲學生專題 開發建築光電3D查詢公共服務" (in Chinese), 2026-08-19: https://www.fcu.edu.tw/news/2026081901/
- Academia Sinica 3D spatiotemporal information platform: https://earth.rchss.sinica.edu.tw
Leave a comment
Comments are reviewed before publication. Email is private and used only when contact is necessary. Privacy notice