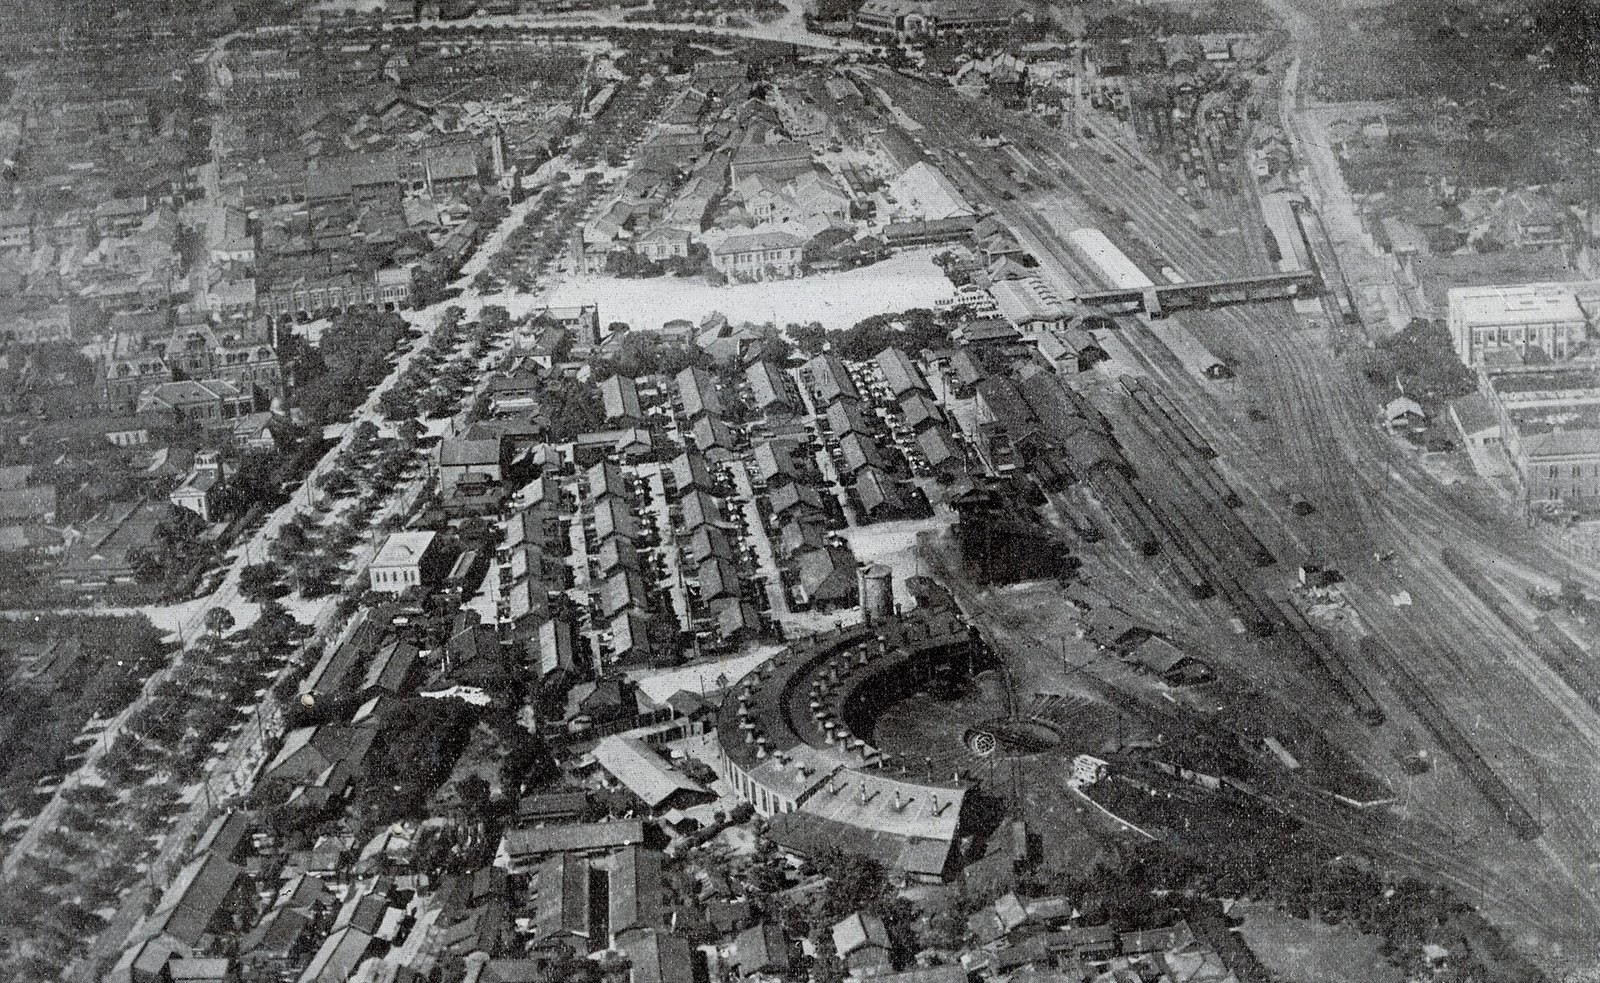
In an aerial photograph taken around 1930, the area beside Taihoku (Taipei) Station is covered in track. The main line runs out from the station, with rail yards and a fan-shaped roundhouse beside it, and a grid of street blocks lines both sides of the railway. For decades afterwards, trains crossed central Taipei at ground level. A 2026 master's thesis by Kung Yu-Ming at the Department of Geography, National Taiwan Normal University (NTNU), "The Impact of Railway Grade Separation on Urban Stitching: A Case Study of the Taipei Railway Underground Project," notes that at-grade railways often act as linear barriers in urban space, widening differences between the two sides in land use, urban functions and spatial connectivity.
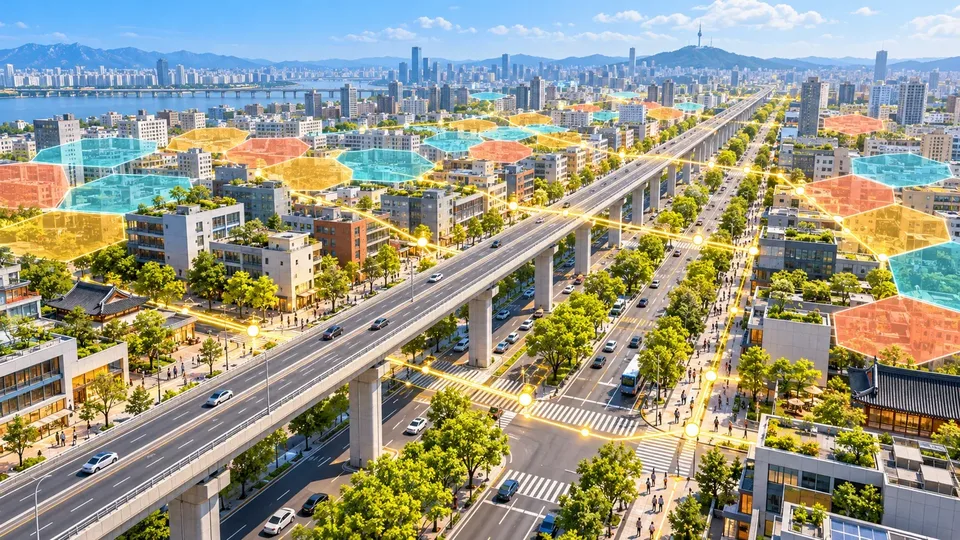
From 1983 onward, that barrier was moved underground one stretch at a time, and the strip it left behind became roads. Whether the neighborhoods on either side really joined up once the tracks were gone can be checked, stretch by stretch, with spatial data. The sections below walk through the construction, what the thesis measured, how Japan measures the same thing and reuses old rail land, and how geographic information systems (GIS) can help with analysis, presentation and collaboration.
Taipei's railway went underground in four phases
The "Benefit Evaluation Report on the Taipei Metropolitan Area Railway Underground Project" (2011), commissioned by the Railway Reconstruction Bureau of the Ministry of Transportation and Communications, divides the work into four phases that together removed 39 level crossings. A level crossing is where a road meets the railway on the same level; when a train comes, the barrier drops and cars and people wait:
- Taipei Main Station undergrounding: construction began in July 1983 and the line opened on 2 September 1989. The 4.42 km from Huashan to Wanhua moved underground, freeing about 99,000 m² of land, removing 13 level crossings and opening through-routes for Chongqing South/North Road and Gongyuan Road.
- Songshan project: built from July 1989 to June 1994, covering 5.33 km from the Huashan tunnel junction to Songshan and removing 7 level crossings. A 6.4 km east–west elevated expressway from Huanhe North Road to Yongji Road was built above it; this is today's Civic Boulevard viaduct.
- Wanhua–Banqiao project: built from September 1992 to October 2002, covering about 15.38 km from Beimen to the Shulin marshalling yard, removing 4 level crossings and opening through-routes for Kangding Road and Wanda Road.
- Nangang project: construction began in November 1998 and the line opened on 21 September 2008, covering 19.4 km from the Keelung Road intersection to Qidu and removing 15 level crossings.
When the Nangang project opened in 2008, the railway within Taipei City was entirely underground.
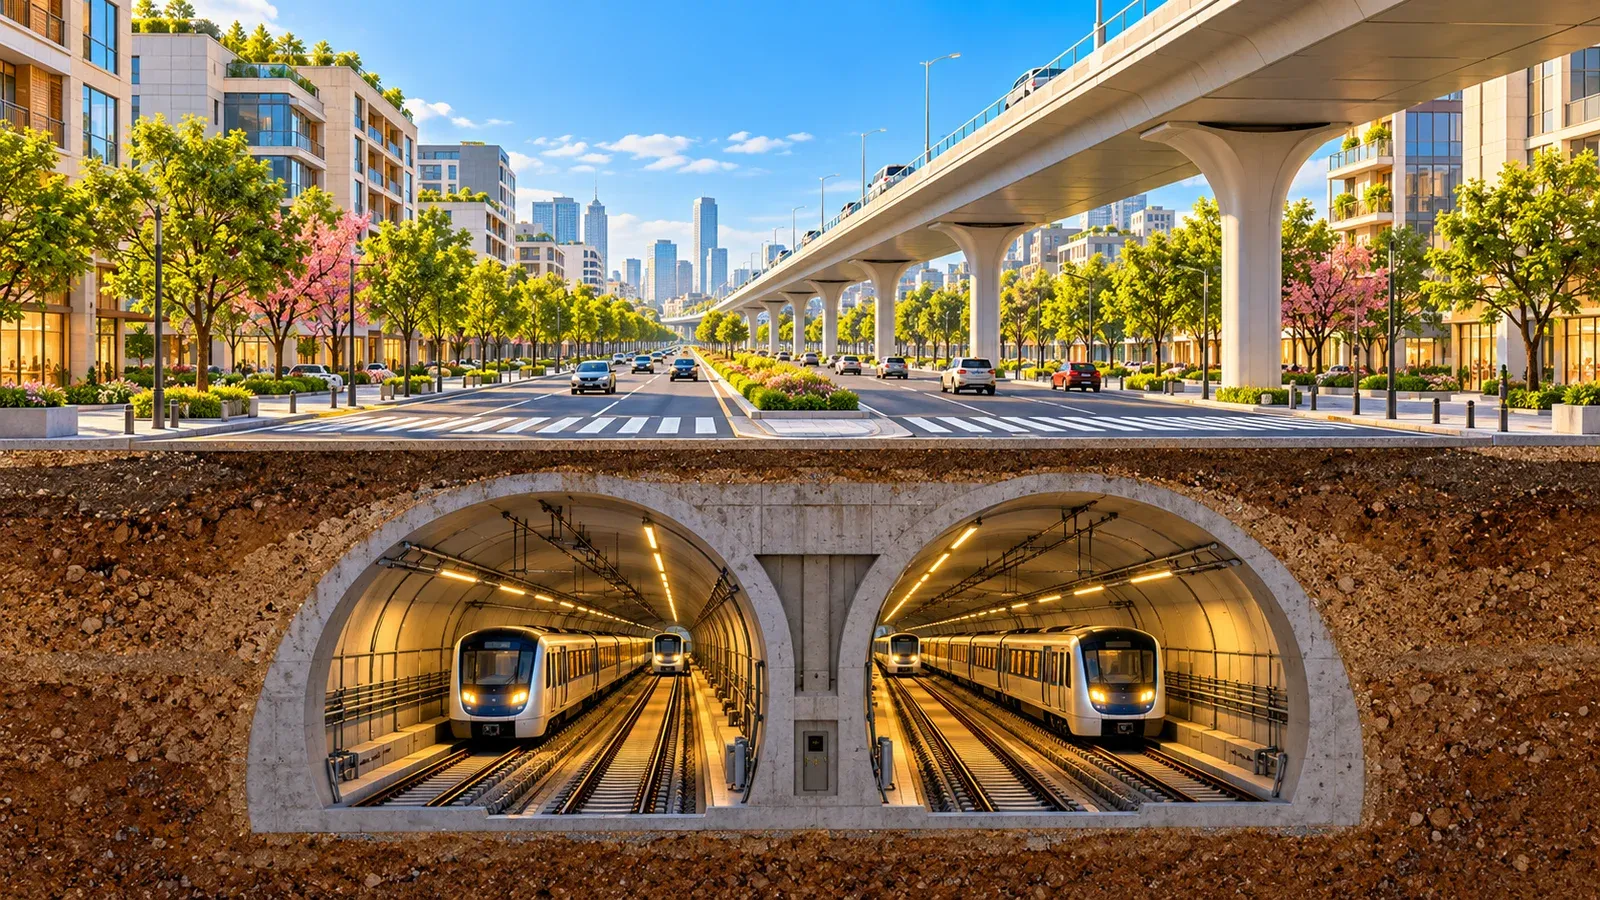
The strip above the Songshan project became today's Civic Boulevard. According to the Railway Bureau's project records and the "Continued Gazetteer of Taipei City," the Civic Boulevard elevated expressway opened along its full length on 7 September 1997. According to the Da'an District gazetteer, the elevated section has a central divider, six lanes in both directions and 7 ramps; the section west of Yongji Road passes through six districts, Zhongzheng, Datong, Zhongshan, Da'an, Songshan and Xinyi, and part of it runs right along the north edge of Da'an District.
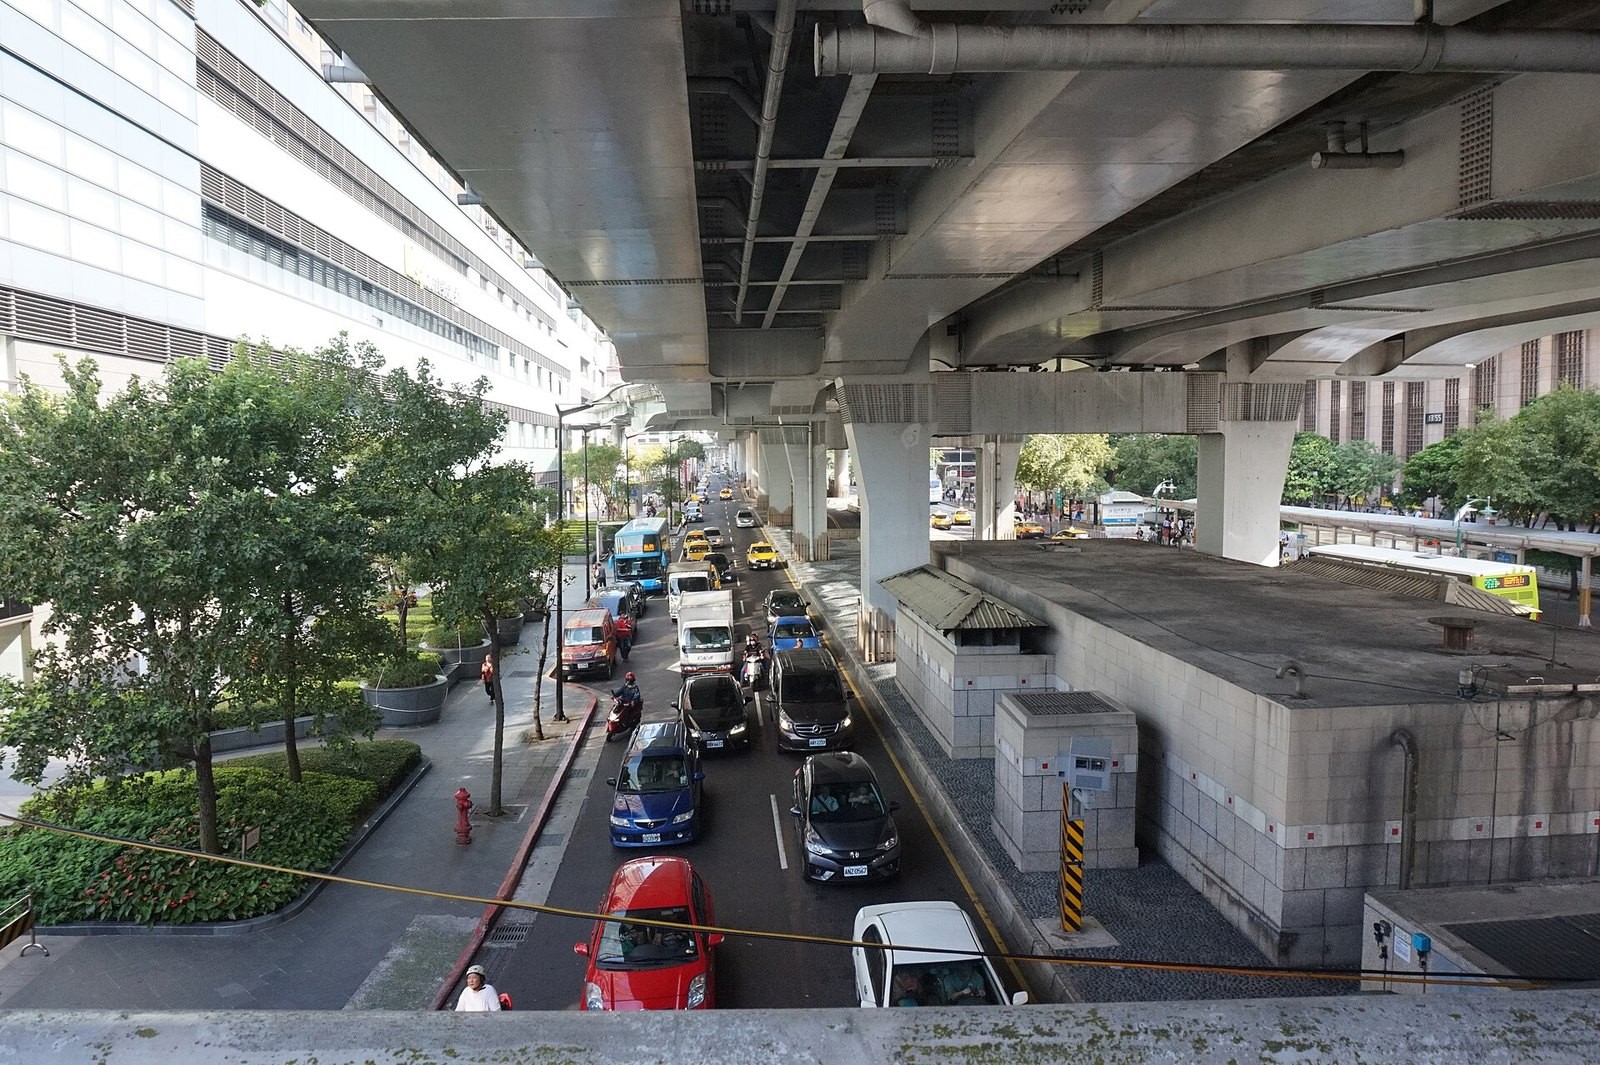
Standing beside Taipei Main Station and looking at Civic Boulevard, you see the elevated expressway on top and surface lanes underneath, with the Taipei Bus Station on one side and Taipei Main Station on the other, while the trains run below the road. The road looks different now. Whether the neighborhoods on either side became easier to move between is the question Kung's thesis sets out to answer.
The thesis compares both sides by transport and land price
The thesis treats the undergrounding as a dividing line and compares the gap between the two sides of the railway before and after. It uses two yardsticks: transport accessibility, meaning how easy it is to get from one place to others, and land price. It finds that undergrounding improved transport links in some sections and led to a restructuring of land values in certain areas, but the stitching effect varied by section, depending on urban development background, station size and the degree of urban-planning intervention.
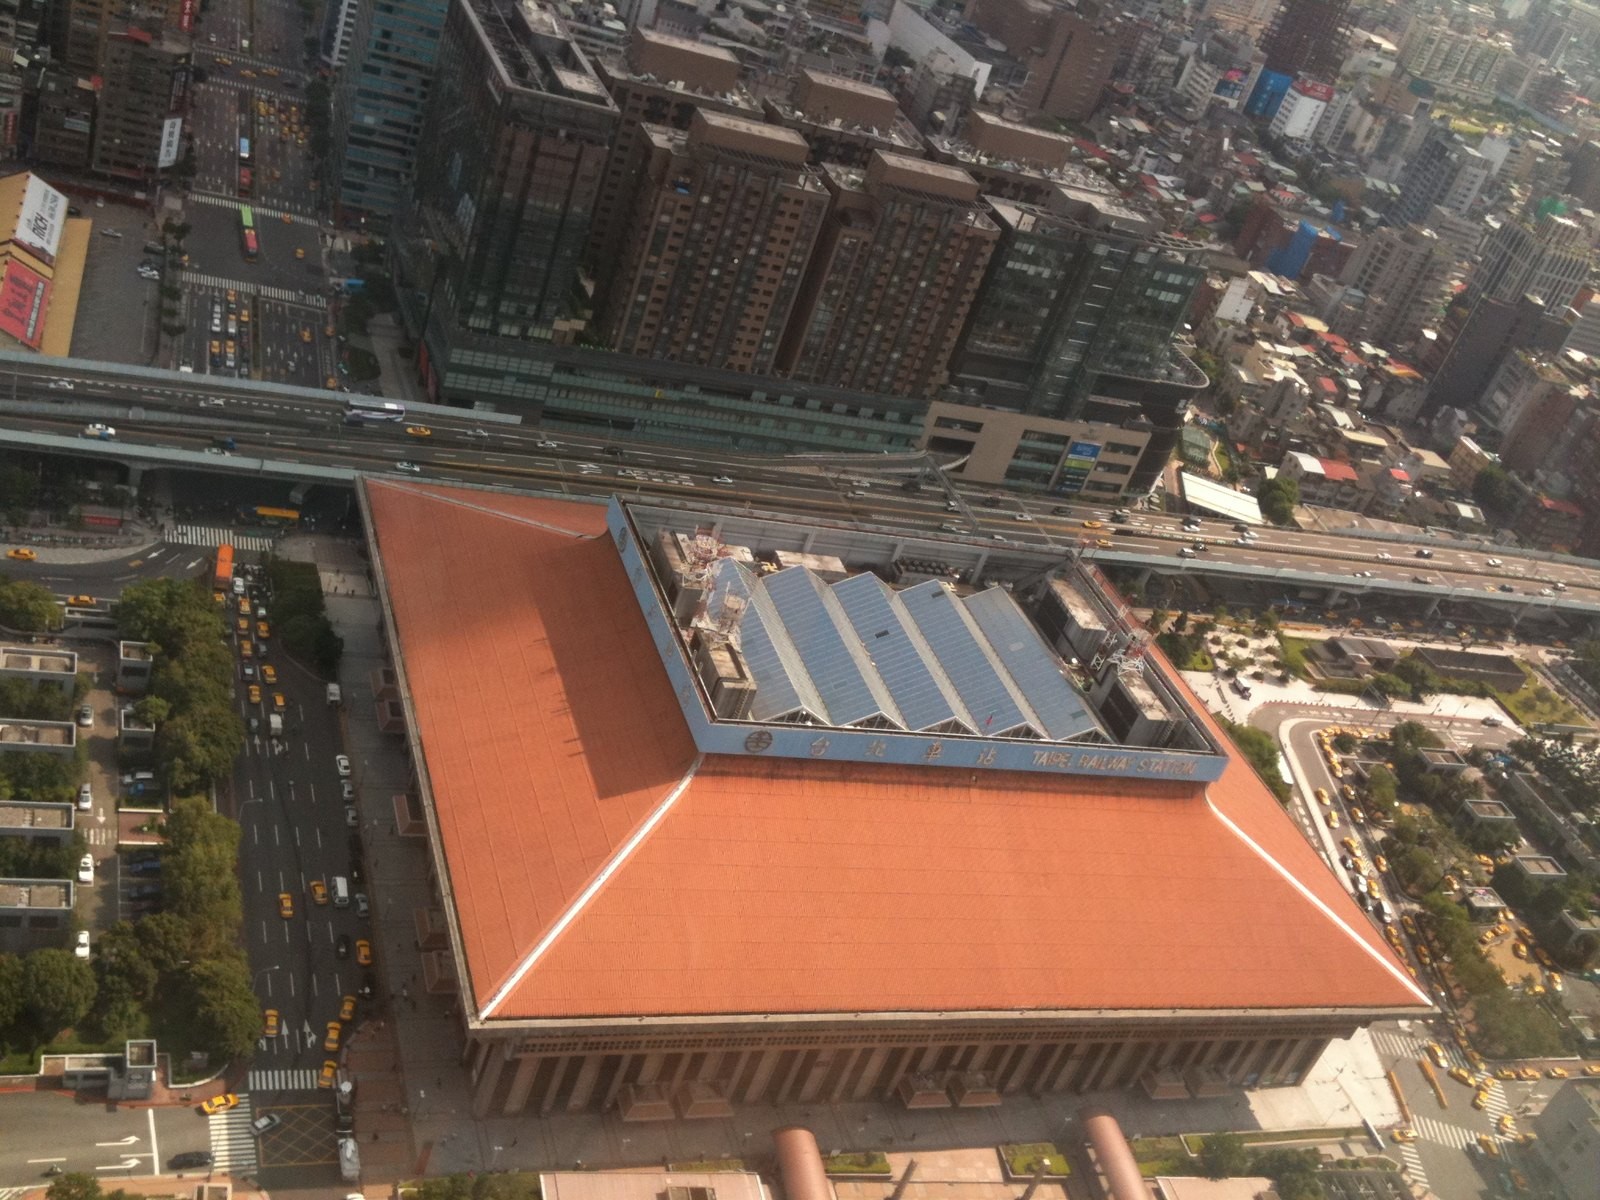
Along the same corridor, some stretches joined up well and in others the gap remains. Finding out why means cutting the corridor into sections and measuring each one, item by item. Japan has been lifting and burying railways for more than half a century, and has worked examples both of how to measure the results and of how to use the land that is freed.
Japan measures rail severance by "how far you can walk" and "how far you have to detour"
In Japan, projects that raise or bury a continuous stretch of railway and remove many level crossings at once are called renzoku rittai kōsa jigyō (continuous grade separation projects). According to the Ministry of Land, Infrastructure, Transport and Tourism (MLIT), local governments carry them out as city planning projects, with government paying about 90% of the cost and the railway operator about 10%. Since the scheme began in fiscal 1968, about 160 projects have been carried out nationwide, removing about 1,700 level crossings. The effects MLIT lists include ending the traffic jams caused by akazu no fumikiri (crossings whose barriers stay down for long stretches), reducing crossing accidents, and joining up neighborhoods split by the railway.
MLIT's March 2014 reference compendium on the effects of continuous grade separation projects lists "resolving urban severance" as an effect and gives two ways to measure it. The first is simple: draw on a map the area you can reach on foot or by bicycle within 5 or 10 minutes of a station exit, and see how much it grows after the project. The second is the detour rate, which captures how far out of your way you have to go: (shortest-path distance − straight-line distance) ÷ shortest-path distance, where the compendium's shortest path is the distance a car drives along the roads. For example, if two places are 600 meters apart in a straight line but 1,000 meters apart by road, the detour rate is (1,000 − 600) ÷ 1,000 = 0.4; the smaller the number, the less detouring. In the compendium's example around Fukui Station, the detour rate fell after the project on the east side of the railway, an area once called ekiura, the "back of the station." The same compendium suggests comparing population change on each side of a station with census grid and neighborhood data, and price change with yearly road-frontage land prices (rosenka) and official land prices.
Researchers use the same before-and-after approach. A 2023 paper by Akihiro Nasu, Kentaro Honma and Kotaro Imai of the University of Tokyo, published in the Journal of Architecture and Planning (Transactions of AIJ), compared how much street-network indices and road-frontage land prices changed before and after grade separation projects, worked out how the two are related, and built a model that sorts land-price rises into grades.
Shimokitazawa and Shibuya turned old rail land into places to walk
When a railway goes underground, a long strip of land opens up at street level, and Tokyo has two examples. According to Odakyu Electric Railway press releases from 2019 and 2022, the Odakyu Odawara Line between Yoyogi-Uehara and Umegaoka was moved underground (in a project run by the Tokyo Metropolitan Government) and expanded to four tracks at the same time. This freed about 1.7 km of former rail land between Higashi-Kitazawa and Setagaya-Daita, named Shimokita Senrogai, covering about 27,500 square meters once crossing roads and railway facilities are excluded. Odakyu chose "support-oriented development" as its theme and worked with Setagaya City to add the greenery the area lacked and make the neighborhood easier and more pleasant to stroll around.
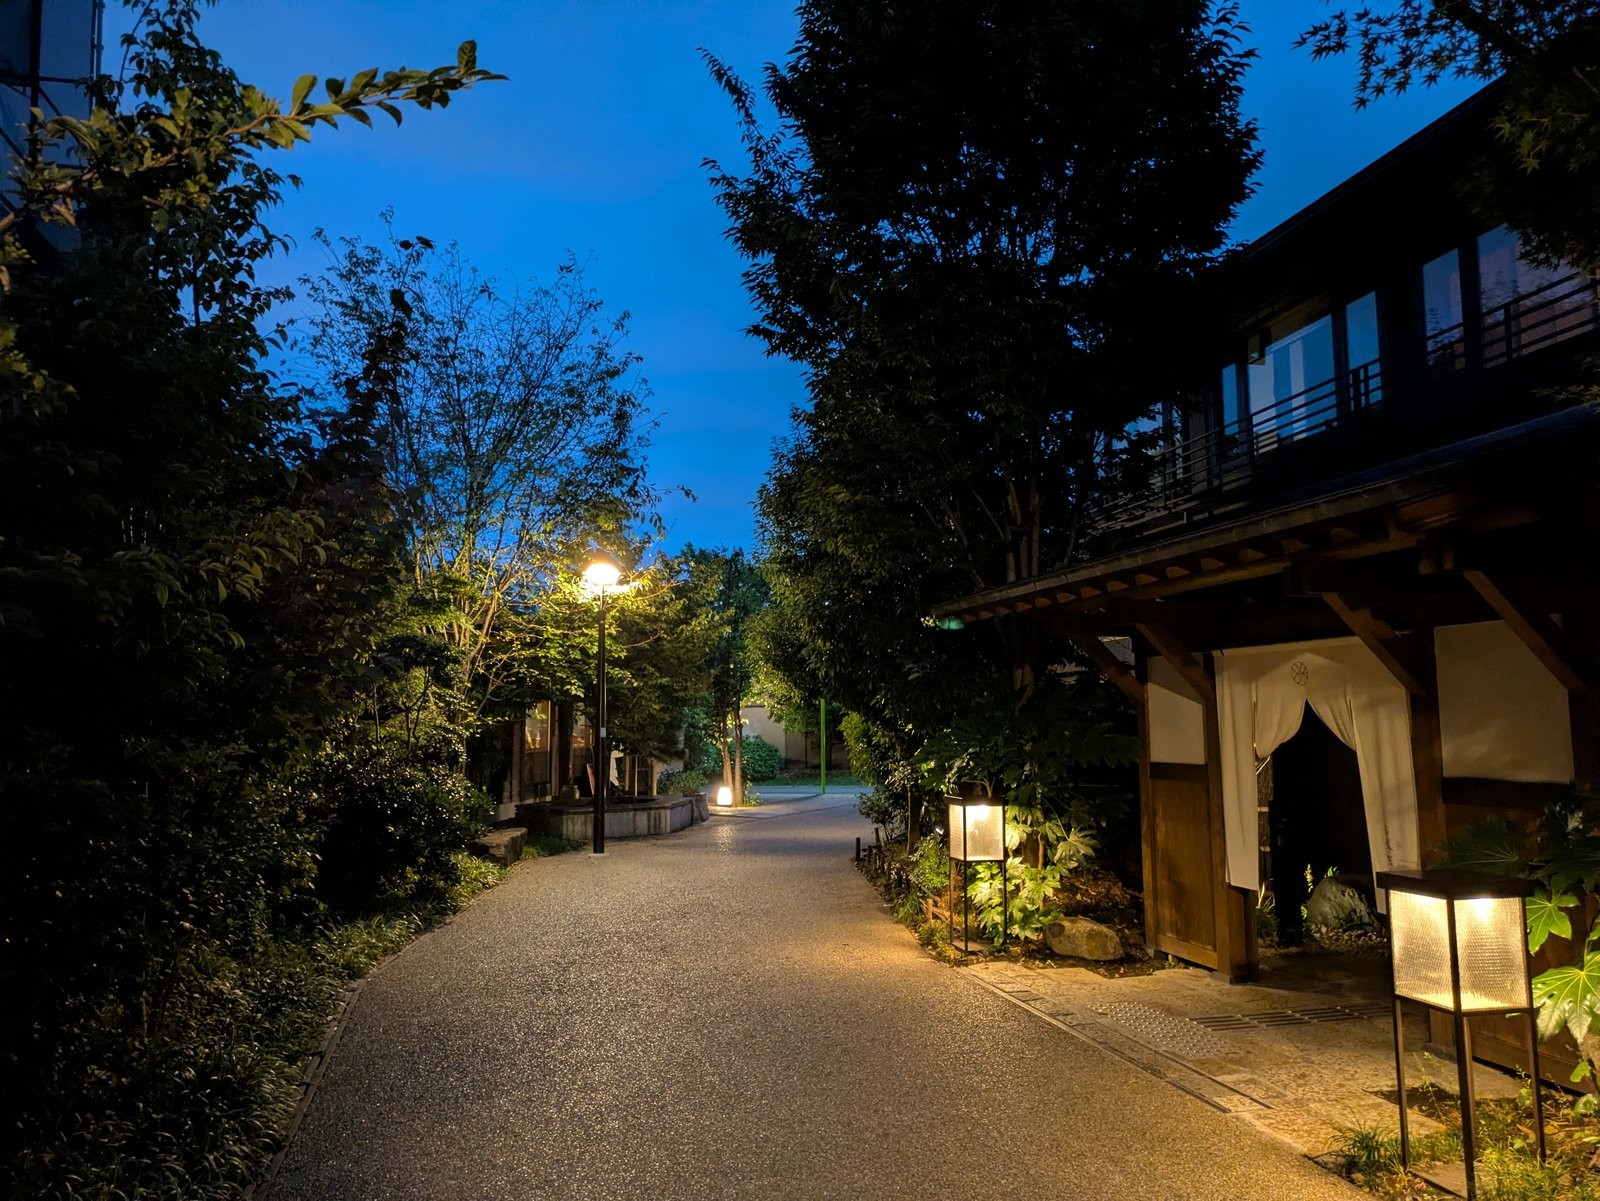
On 28 May 2022, NANSEI PLUS at the southwest exit of Shimokitazawa Station was completed and all 13 areas of Shimokita Senrogai opened. The walkway in the photo is laid on what used to be railway land. The NANSEI PLUS plaza, Nonohara, was built jointly by Odakyu and Setagaya City, and its plants are looked after by a local group, Shimokita Engeibu.
The Shibuya case lies south of the station. According to Tokyu, the Tokyu Toyoko Line went underground in 2013 to run through onto the Tokyo Metro Fukutoshin Line, and the old Shibuya Station's platforms, track bed and surrounding blocks were rebuilt as Shibuya Stream, which opened on 13 September 2018. The area had been cut off by the Shuto Expressway Route 3 and National Route 246. Government and private partners restored the Shibuya River, built Shibuya River Street, a riverside walkway that runs about 600 meters toward Daikanyama, and kept part of the old Toyoko Line viaduct as a pedestrian deck over Route 246.
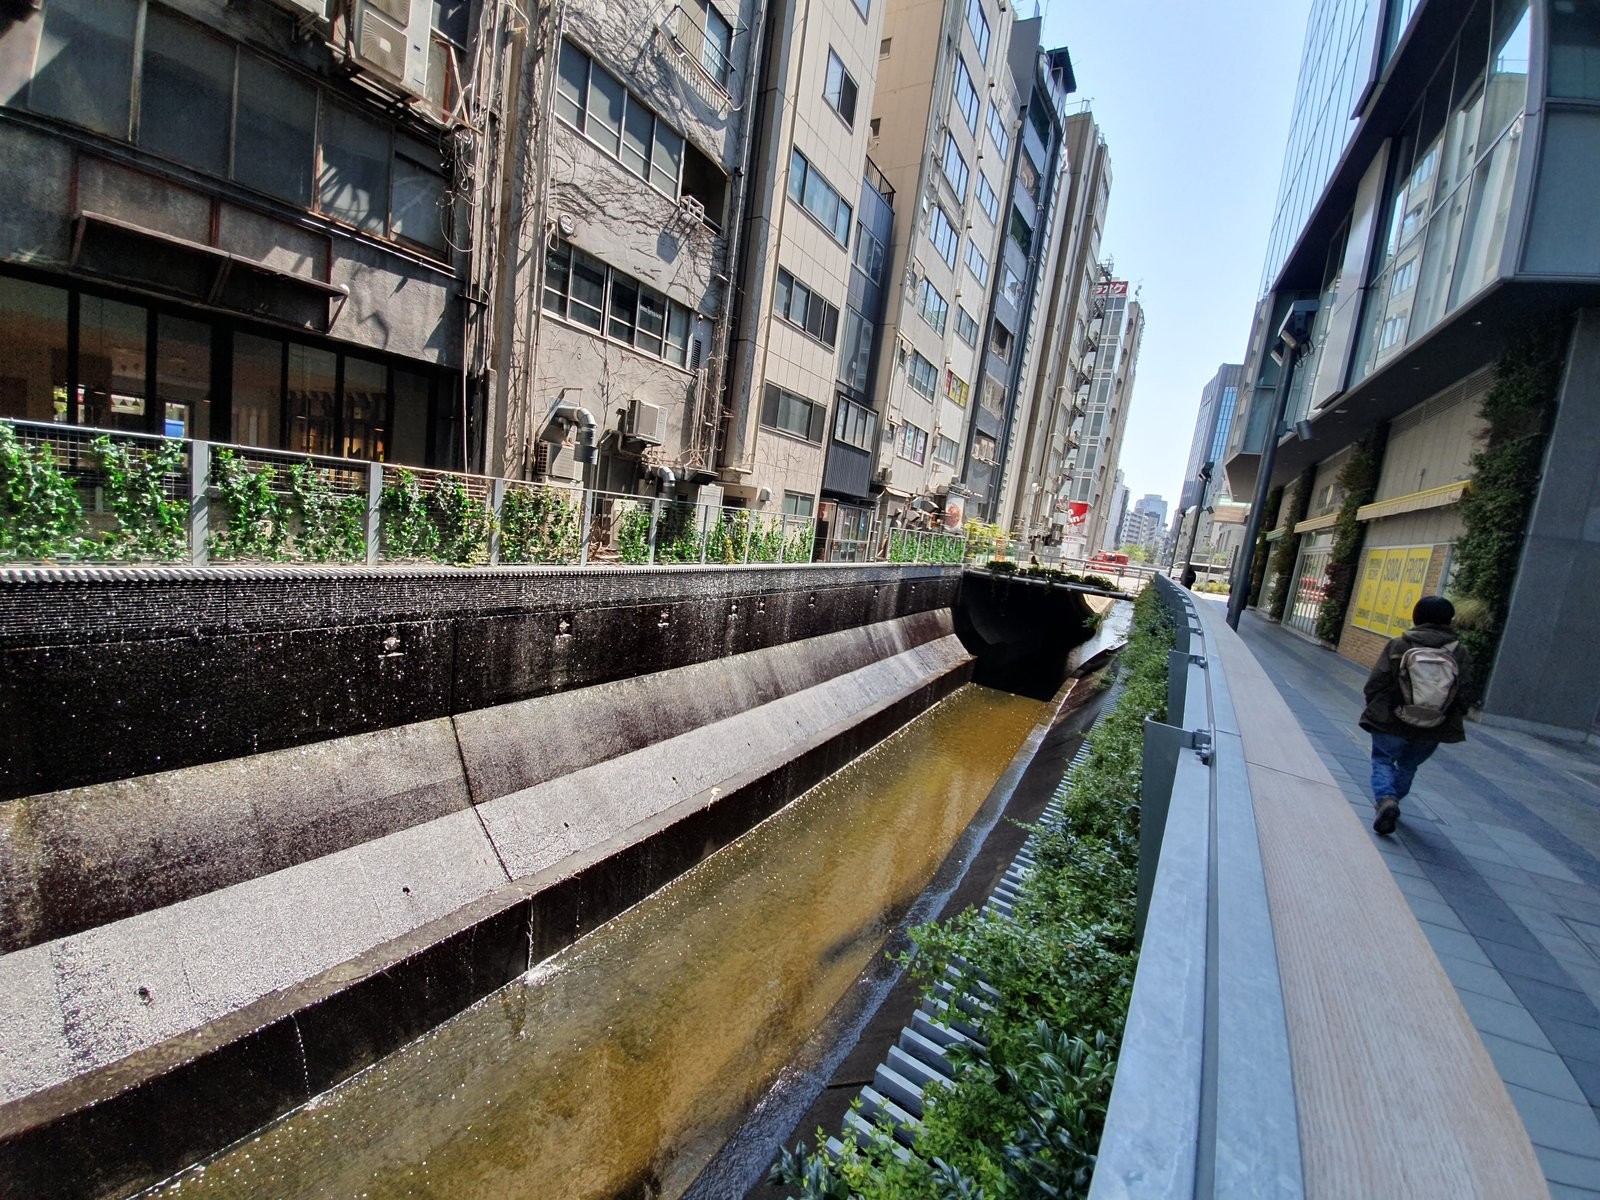
Both cases follow the old track line and string the freed land into one route you can walk from end to end. MLIT's measurement methods and these reuse cases can all become GIS layers along Taipei's corridor, to compare one section at a time.
GIS layers show where sections differ
A GIS layer is like a transparent sheet laid over a map. Each sheet holds one kind of data, and stacking them shows relationships that no single sheet reveals. Following the thesis's approach of comparing before and after, and one side with the other, five kinds of layers can be stacked:
- Crossing-point inventory: every intersection, underpass and footbridge along the corridor where vehicles and pedestrians can cross, tagged with the year it opened or closed. The 13, 7, 4 and 15 level crossings removed in the four phases are the starting point for a before-and-after comparison.
- Network connectivity and detour distance: pick the same start and end points on both sides of the corridor, compare the shortest route with the straight-line distance, work out the detour rate and walkable reach described above, then check against crossing points and site visits to find out why people have to detour.
- Land-use zoning: compare zoning categories on both sides of the corridor to see whether the same functions spread across it once connections improve.
- Land-price time series: line up land prices on both sides year by year and watch how the gap changes, matching the land-value restructuring described in the thesis.
- Administrative boundaries: the Civic Boulevard section west of Yongji Road crosses six districts, so district boundaries and statistical units can serve as background for comparing sections.
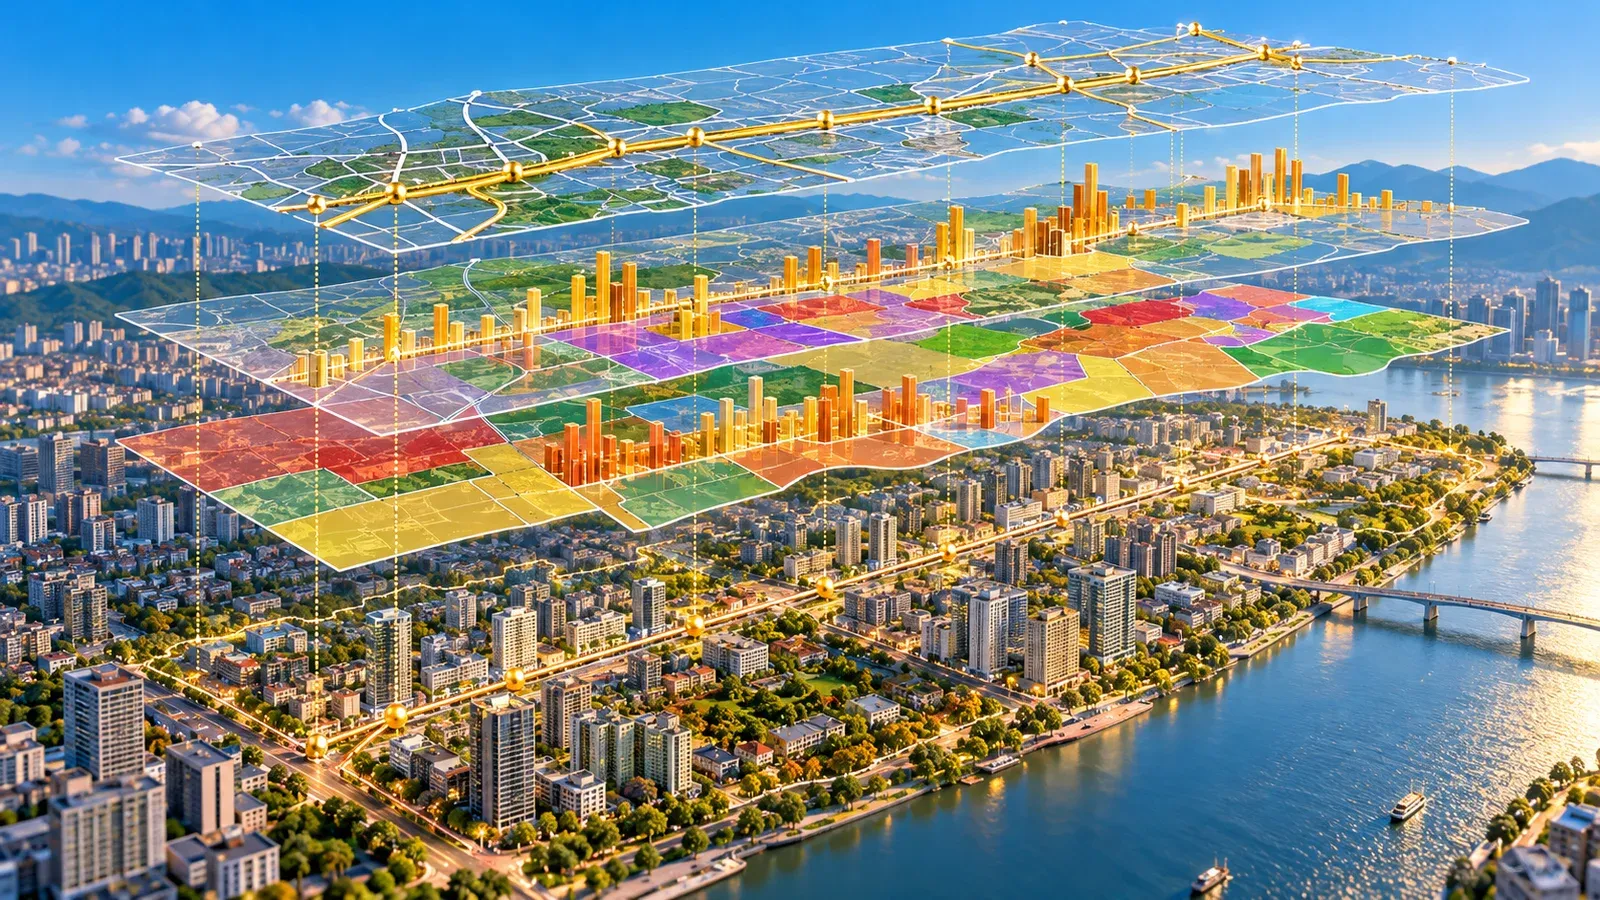
Station size and the degree of urban-planning intervention, both named in the thesis, can be recorded as attribute fields for each section to help find possible reasons for the differing results. Overlaying these layers helps compare connectivity on the two sides of the corridor before and after a physical barrier is removed. Once the analysis is done, it still has to make sense to people living along the corridor, so how results are shown matters as much as the analysis itself.
3D models and hexagon maps make results easier to read
Taiwan already has a 3D base map that can carry these layers. According to a results summary from the National Land Surveying and Mapping Center (NLSC) of the Ministry of the Interior, the center completed a nationwide 3D building model in 2019 and updated or newly produced 2.15 million 3D building models in 2022. They can be viewed on the "Multi-dimensional National Spatial Information Service Platform" and are served in OGC I3S and 3D Tiles, two common 3D formats, while 2D layers come from the "NLSC Maps" service cloud. These datasets are a foundation for city digital twins, computer models that mirror a real city; for how they are supplied, see "Taiwan's NLSC Starts Selling 1:1000 Maps and 3D City Meshes."
To compare indicators across sections, a hexagon map is another option. Every unit is drawn as a hexagon of the same size, so readers only need to compare colors. The "Lifehacker Islands" website is one example: its 34 hexagonal islands each match a real channel on Discord, and a tile lights up when its channel has had activity in the past 24 hours.

The same layout can present city issues. A build prompt for a "Policy Islands" interactive site plans a Three.js demonstration: data is kept in a single DATA object, the hexagonal islands are arranged by that data, and the scene is generated from a fixed seed so it looks the same every time; pedestrians walk the road network by shortest path, collaboration lines are solid, dashed or dotted by level of evidence, and the user's "reduce motion" setting is respected. The prompt calls for fictional demo data and serves as a design example of the technique.
Applied to the rail corridor, crossing points, the road network and land prices can go into one data structure, with line styles showing levels of evidence and sources clearly labeled. For an example of 3D building data turned into a public lookup tool, see "Rooftop Solar by Address: How Taiwan's 3D Map Estimates It." Datasets like these need people to keep curating and updating them, and Taiwan's civic tech community has years of experience with that.
Open collaboration keeps spatial data up to date
According to g0v's early official website, g0v grew out of a team competing at Yahoo! Open Hack Day and held its first hackathon at the end of 2012. The g0v homepage says the community values information transparency, open results and open collaboration, holds a large hackathon every two months, and that more than 60% of participants have no technical background.
Events where people gather to build things can also put data straight onto the map. A 2021 study in Scientific Reports by Herfort and colleagues at Heidelberg University analysed the full edit history of OpenStreetMap, an open world map anyone can edit, since 2008, and found that humanitarian mapping, including post-disaster activations and mapathons, added about 60.5 million buildings and 4.5 million roads. A 2021 study by Schott and colleagues from the same group compared participants' edits before and after mapping events and found that newcomers who attended field-mapping events tended to go on updating existing data around them with higher accuracy. A field-mapping event along Taipei's corridor, with participants recording crossing points and walking paths as they go, could supply the base data for the network analysis described earlier.

Keeping data and results going after an event ends takes a steady way of organizing, and internet standards bodies offer a model. The IETF website says the organization was founded in 1986 and has no membership; anyone can take part by joining a working group mailing list or registering for a meeting, and more than 7,000 people a year participate by drafting documents, discussing on mailing lists and attending meetings. Most work happens in more than 100 working groups, each with a charter approved by the IESG; groups decide by "rough consensus" rather than formal voting, under the principle of "rough consensus and running code." The RFC series has more than 9,000 documents, covering the IETF and other publication streams. The Internet Society (ISOC) provides the corporate home for the administrative entity that supports the IETF. City issues could follow a similar model: chartered working groups focused on specific tasks, plus shared protocol-like rules such as common data formats and levels of evidence.

AI tools help this kind of collaboration get going faster: ideas quickly become simple prototypes, prompts do not need to be long, and the skill that matters more is judging which information is important and how to present it and let people interact with it. The easier prototypes become, the more important it is to state up front what data AI can access, where that data comes from and where it is stored. The footer of Taiwan's Government Open Data Platform lists the Ministry of Digital Affairs; the "Open Government Data License, Version 1.0" was established on 27 July 2015, and government open data released under it can be used according to its terms.
Possible directions for Taiwan
Putting the engineering record, the thesis results and Japan's experience together, the following directions could turn "how well the city has been stitched" into spatial data that can be checked:
- Build an open dataset of corridor crossing points: starting from the level crossings removed in the four undergrounding phases, compile the locations and opening years of intersections, underpasses and footbridges, and release them under the open-data license.
- Publish stitching indicators regularly: calculate and publish yearly indicators from the network and land-price layers above, so the thesis's before-and-after comparison keeps being updated.
- Run corridor spaces with local groups: Taipei has already rebuilt the corridor above the Songshan project as Civic Boulevard; the spaces under and along the viaduct could follow Shimokita Senrogai, with the city government, operators and local groups sharing planning and upkeep and pedestrian-flow data used to track results.
- Publish results on a 3D base map: overlay crossing points, detour distances and land-price changes on NLSC's 3D building models for residents along the corridor to look up.
- Set up a corridor data working group: use field-mapping events to fill in crossing points and walking paths, maintain a shared data format, and confirm the data-governance checklist before any AI prototype starts.
Methods and Data for GIS Research
GIS courses and research units that want to take this topic further can start with the following methods and open data.
Methods:
- Network analysis and service areas: shortest routes along real roads, plus isochrones, the area reachable from a point within a set time; the walkable reach and detour rate described above are both calculated this way. See the QGIS network analysis documentation.
- Street-network indicators: give each street segment a score for how tightly it connects with other streets and how many routes pass through it, as in the study by Nasu and colleagues cited above.
- Difference-in-differences: take a section unaffected by the works as a control, subtract its before-and-after change from the change in the project section, and what remains is more likely linked to undergrounding.
- Hedonic price model: break a home's sale price into items such as location, building condition and distance to the corridor, and estimate what each item is worth; the theory is set out in Rosen (1974).
- Hexagonal binning: total up indicators in equal-sized hexagons, the method behind the hex map described earlier; H3 is a widely used grid system.
Open data:
- Ministry of the Interior actual-price real estate open data (in Chinese): batch data on property transactions, free to download under the ministry's terms of use, for building land-price time series.
- NLSC Taiwan Map Service (in Chinese): the 2D base-map service mentioned earlier, with a range of base maps and thematic layers.
- TGOS (in Chinese): the Ministry of the Interior's geographic information platform, offering services such as address geocoding.
- Socio-Economic Data Service Platform (SEGIS) (in Chinese): population and socio-economic statistics by statistical area, for comparing population change on both sides of the corridor.
- Transport Data eXchange (TDX): public transport stops, routes and real-time data from the Ministry of Transportation and Communications, for accessibility analysis beyond walking.
- Taipei Open Data Platform (in Chinese): open data from Taipei City Government agencies, released under the Open Government Data License.
- Government Open Data Platform (in Chinese): the cross-agency open-data catalogue mentioned earlier.
- OpenStreetMap: community-maintained road and footpath data under the ODbL, usable as the network for network analysis.
- National Land Numerical Information: Land Price Publication (in Japanese): MLIT point data on officially published land prices, with data from 2019 onward under CC BY 4.0, for comparison with the Japanese cases.
- PLATEAU: MLIT-led 3D city models, with terms of use compatible with CC BY 4.0.
Sources:
- Kung Yu-Ming, "The Impact of Railway Grade Separation on Urban Stitching: A Case Study of the Taipei Railway Underground Project" (in Chinese), master's thesis, Department of Geography, National Taiwan Normal University, 2026: https://www.airitilibrary.com/Article/Detail/U0021-NTNU48821
- Railway Reconstruction Bureau, MOTC, Benefit Evaluation Report on the Taipei Metropolitan Area Railway Underground Project (in Chinese), October 2011: https://www.rb.gov.tw/public/files/artsinfo/1526564261-0.pdf
- Railway Bureau, completed works of the Taipei railway undergrounding (in Chinese, with English sections): https://www.rb.gov.tw/public/files/artsinfo/1526565319-0.pdf
- Taipei City Government, Continued Gazetteer of Taipei City, Land volume, urban development (in Chinese): PDF
- Taipei City Government, Da'an District Gazetteer, volume 5, transportation (in Chinese): PDF
- Ministry of Land, Infrastructure, Transport and Tourism (MLIT), continuous grade separation projects (in Japanese): https://www.mlit.go.jp/toshi/toshi_gairo_tk_000020.html; project overview: PDF
- MLIT, reference compendium on the effects of continuous grade separation projects (in Japanese), March 2014: https://www.mlit.go.jp/common/001083622.pdf
- Akihiro Nasu, Kentaro Honma and Kotaro Imai, "Network analysis of effectiveness that elevated railway project brought about on roadside land price," Journal of Architecture and Planning (Transactions of AIJ) 88(805), 2023: https://doi.org/10.3130/aija.88.894
- Odakyu Electric Railway press releases (in Japanese), 24 September 2019: https://prtimes.jp/main/html/rd/p/000000618.000012974.html; 11 April 2022: https://prtimes.jp/main/html/rd/p/000000979.000012974.html
- Shibuya Stream, About (in Japanese): https://shibuyastream.jp/about/; Tokyu, Shibuya Stream fact sheet (in Japanese): PDF
- Herfort, B. et al., "The evolution of humanitarian mapping within the OpenStreetMap community," Scientific Reports 11:3037, 2021: https://doi.org/10.1038/s41598-021-82404-z
- Schott, M. et al., "The Impact of Community Happenings in OpenStreetMap," ISPRS International Journal of Geo-Information 10(3):164, 2021: https://doi.org/10.3390/ijgi10030164
- NLSC, Ministry of the Interior, summary of the 2022 3D building model update (in Chinese): Changhua County Land Office website
- IETF, Introduction to the IETF: https://www.ietf.org/about/introduction/; Working groups: https://www.ietf.org/process/wgs/; RFCs: https://www.ietf.org/process/rfcs/
- Internet Society, Open Internet Standards: https://www.internetsociety.org/our-work/how-the-internet-works/open-internet-standards/
- g0v: https://g0v.tw/intl/en/; early official website: https://dev.g0v.tw/Home.html
- Government Open Data Platform: About; Open Government Data License, Version 1.0
- Lifehacker Islands: https://islands.lifehacker.tw/
Leave a comment
Comments are reviewed before publication. Email is private and used only when contact is necessary. Privacy notice