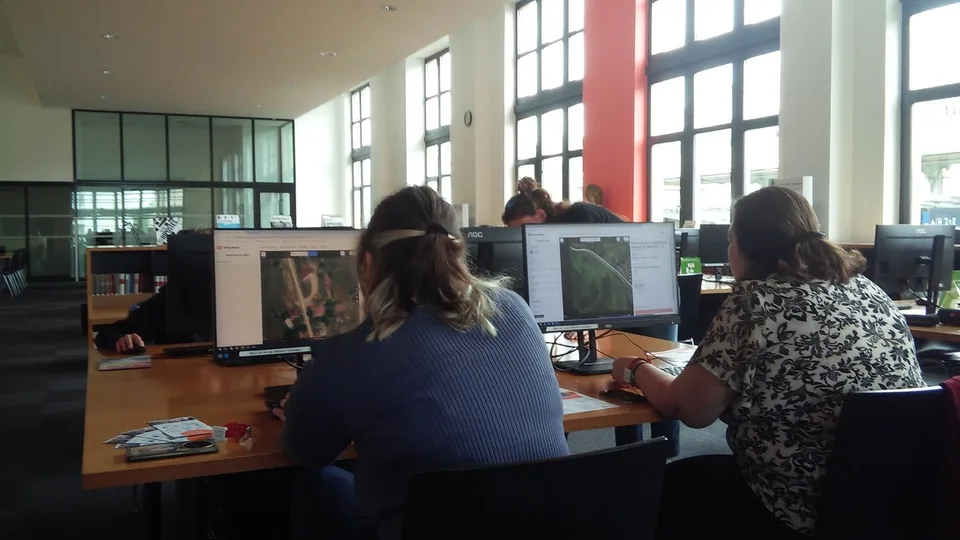
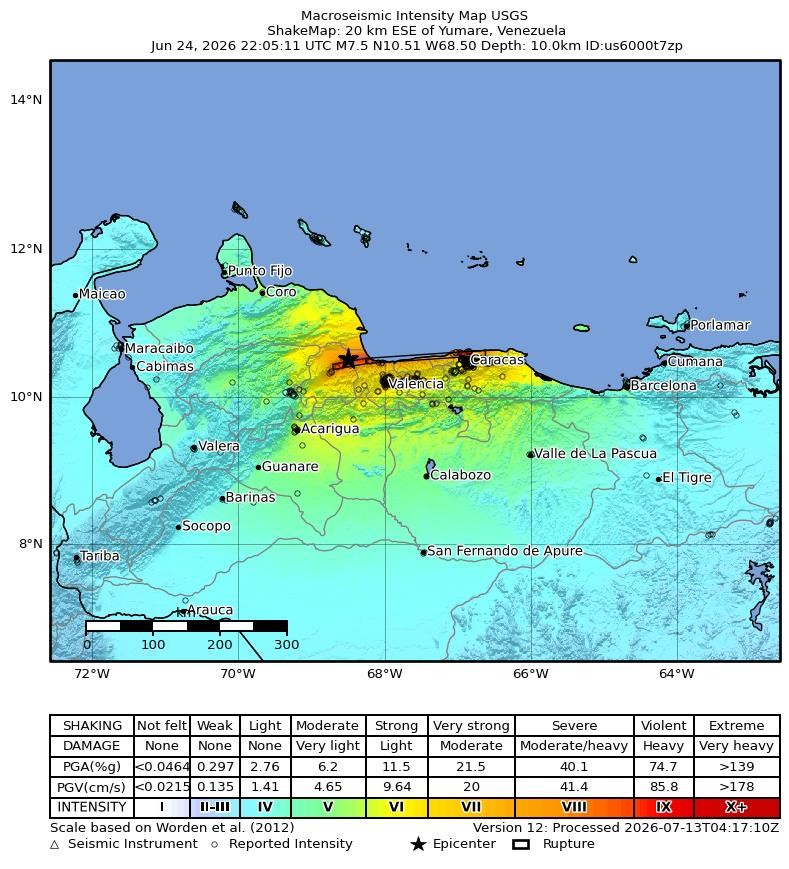
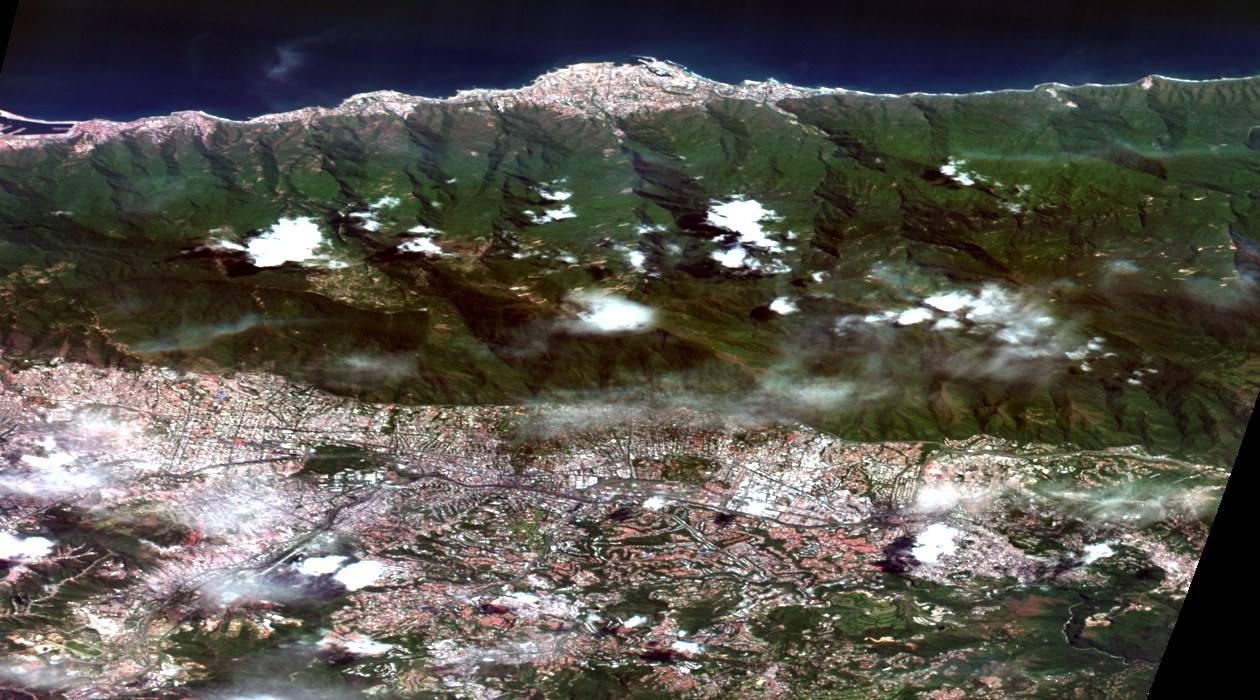
On 24 June 2026, two earthquakes struck northern Venezuela seconds apart. A magnitude 7.2 foreshock was followed by a magnitude 7.5 shock, about 160 km west of the capital, Caracas. Responders started with plain questions: how many buildings are in the affected area, where are they, and which ones are damaged.

Within 24 hours, the Humanitarian OpenStreetMap Team (HOT) used its AI-assisted mapping tool fAIr to deliver building density, AI-detected building footprints and building-damage predictions. The layers came from post-event Vantor satellite imagery and went to early responders such as the International Organization for Migration (IOM) and MapAction, who used them to decide where to send people first.
On 21 October, Robin Cole, host of the Satellite Image Deep Learning podcast, talked with Petya Kangalova and Kshitij Raj Sharma of HOT about how this works. This article follows the interview and HOT's public documentation to show how volunteers and AI share the work.
HOT starts with volunteer mapping and uses AI to scale it up
HOT is a non-profit organisation founded about 15 years ago. It has around 70 staff and works in four regions. Its core work has been rallying volunteers around the world to trace buildings and roads from satellite imagery into OpenStreetMap (OSM).
GeoAI means applying artificial intelligence to maps and geographic imagery. A common task is teaching a computer to find roofs, roads or water tanks in aerial photos.
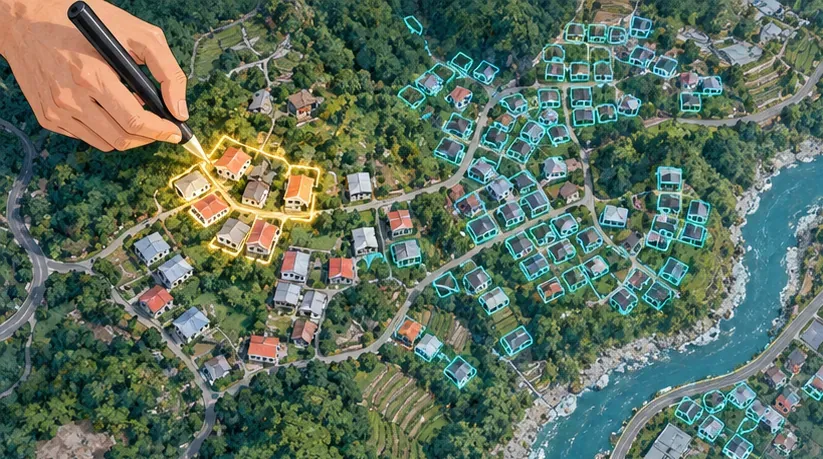
In fAIr, volunteers first trace buildings by hand in a small area, then that data is used to fine-tune a model that scans a much larger area. Fine-tuning is like a cook who knows home cooking moving to a new city and making a few dishes alongside local people to learn the local ingredients. A base model has already seen houses from many places. After a few hundred local roofs, it gets better at recognising sheet-metal shacks, flat concrete roofs or dense informal housing.
One example in the fAIr catalogue is "dinov3s-buildings-finetuned-banepa-v2", a region-specific model fine-tuned on building data from Banepa, Nepal. How base models and satellite embeddings work is covered in our earlier article, OlmoEarth v1.3 Releases Global 10 m Satellite Embeddings, so this piece sticks to how fAIr uses them.
fAIr currently works with very high-resolution colour (RGB) imagery sharper than 1 m, mainly from the open imagery platform OpenAerialMap. Its output is GeoJSON points, lines or polygons that load straight into geographic information system (GIS) software. Training labels come from three places: beginners swiping in the MapSwipe phone app, experienced mappers tracing in HOT's Tasking Manager, and advanced users drawing features themselves.
AI predictions are checked by people before use

The fAIr documentation calls model output "suggestions" that a person must review. There are three ways to check them: accept or reject each one in the editor, confirm them on the ground with the Field Tasking Manager or ChatMap, or hand them to a crowd on MapSwipe.
MapSwipe works a bit like sorting photos. The phone shows satellite tiles one by one; volunteers tap a tile if they see damage and swipe on if they do not. ChatMap uses WhatsApp groups so people on the ground can send back locations, photos and videos.
In Venezuela, 2,681 MapSwipe contributors in 23 projects produced more than 180,000 results checking damage predictions from fAIr and Microsoft's AI for Good Lab. The outcome was a human-validated damage assessment for three cities: Caraballeda, La Guaira and Caracas. Separately, 590 contributors traced about 97,000 building footprints in OSM, part of 136,000 edits during the response.
The Humanitarian Data Exchange (HDX) explains the method. AI compares pre- and post-event imagery, the results are aggregated to an H3 hexagonal grid, and several volunteers vote on each cell; a cell counts as damaged when the majority agrees. HDX also notes that the votes are based on imagery alone and were not checked on the ground.
fAIr also keeps AI-drawn buildings out of OSM. HOT publishes validated results separately on HDX and Hugging Face as open data layers. For research on how much volunteer mapping has added to OSM, see the studies cited in our note Using GIS to Read Taipei's Railway Undergrounding and Civic Boulevard.
STAC-MLM turns each model into a searchable catalogue card

STAC stands for SpatioTemporal Asset Catalog. It works like a library card: each card records where a satellite image was taken, when, and where the file lives. When every provider uses the same card format, one set of tools can search imagery from all of them.
MLM, the Machine Learning Model extension, applies the same cards to AI models. An MLM card states how many bands and what image size a model expects, which preprocessing it needs, which classes it outputs, what runtime it uses, where the weights are and what data trained it. It is a bit like the leaflet in a medicine box: whoever picks it up can learn how to use it, and how not to, without calling the maker.
The MLM extension is maintained by the Computer Research Institute of Montréal (CRIM), Wherobots, Terradue and Natural Resources Canada under the Apache-2.0 licence. Version 1.6.0 came out on 23 September 2026, with its maturity marked "Candidate".
The fAIr catalogue has three collections: base models, region-specific fine-tuned models and datasets. Each model has a Docker image, its weights sit on Hugging Face with a hash, and its STAC card records the geographic region it was trained on. A user can look up where a model learned before deciding whether to run it on their own city.
HOT's open call pays USD 3,000 for each accepted model
On 2 July 2026, HOT opened a call for Earth observation GeoAI models, closing on 31 December. It covers seven categories: residential areas, critical public infrastructure, water, sanitation and hygiene (WASH), livelihood infrastructure, transportation, essential utilities, and emergency and public service facilities.
Submissions need a model card, open weights and a STAC-MLM description, and must pass fAIr's tests. In the interview, the team said each model should come with four pipelines, for preprocessing, inference, fine-tuning and post-processing, so it can be retrained in a new area. Each accepted model earns USD 3,000 and access to MapSwipe's human-verified datasets and feedback.
Models available in the catalogue today cover buildings, swimming pools, parking spaces and solid waste. Models for trees, seagrass, roads and more are being built through two open challenges, Omdena with about 50 participants and Zindi with more than 100 expected.
The limits are stated plainly. fAIr handles only RGB imagery sharper than 1 m for now. Support for 10 m class satellite data such as Sentinel-2 may come next year, according to the interview.
Colombia's earthquake and Nepal's floods used the same workflow
On 10 August 2026, a magnitude 7.4 earthquake centred in Chocó struck western Colombia. HOT worked with OSM Colombia, the national disaster risk agency UNGRD, UN Maps, the UN Development Programme (UNDP) and the geographic institute IGAC to set priority areas. By 8 September, more than 450 contributors had mapped buildings and roads, and 717 MapSwipe contributors produced more than 49,000 results in two projects for Viterbo and La Tebaida. Building and damage predictions for the Pereira area are on Hugging Face.
In August, flash floods and mudslides hit Rasuwa district in Nepal. Within 24 hours, HOT, NAXA and Nepal's disaster authority NDRRMA opened the first mapping project, and two fAIr region-specific models took on separate jobs: one found buildings, the other scored damage for each building. 338 experienced mappers added 20,100 buildings to OSM, and 4,170 MapSwipe contributors produced more than 423,000 validation results in nine projects.
Everyday uses are growing too. The interview mentioned that the "Map Your City with fAIr" community call has more than 25 projects. Other examples include work with Bali's disaster agency on volcano evacuation routes and tsunami risk, and the "Know Your City" project mapping informal settlements in Sierra Leone and Liberia.
Possible directions for Taiwan

- The OpenStreetMap Taiwan community (OSM Taiwan) already runs mapping events and beginner guides. It could trace buildings in a small part of a disaster-prone township as seed data for fine-tuning a region-specific model.
- The National Land Surveying and Mapping Center (NLSC) runs a Web Map Tile Service (WMTS) with yearly orthophotos (up to 2025) and a building-outline layer for the Taiwan e-Map. The first could serve as imagery and the second as a reference for building labels. Each layer's licence should be checked before training. For NLSC's 1:1,000 maps, see NLSC Begins Supplying 1:1,000 Topographic Maps and 3D Mesh Models.
- The National Science and Technology Center for Disaster Reduction (NCDR) publishes a 3D Disaster Potential Map covering flooding, slopes, soil liquefaction, tsunami inundation and volcanoes, with data downloads. Overlaying an AI building layer on these hazard maps would show which areas to validate first, so volunteer time goes where it matters most. During emergencies, NCDR's disaster information platform brings the situational data together.
- The government open data platform lists the Taiwan e-Map (for example dataset 25108) under the Open Government Data License, version 1.0. Future AI-derived building or damage layers could follow the STAC-MLM approach and state the model, training region and validation method in their metadata.
- After the Mataian River barrier lake overflowed into Guangfu, Hualien, in September 2025, civic tech volunteers built several relief maps within days, and a g0v summary page lists them. With a shared data format, the tools built next time could connect to each other.
Methods and Data for GIS Research
- Model catalogue and pipelines: hotosm/fAIr-models holds the STAC catalogue of base and region-specific models, and the Python package fair-py-ops uses ZenML to run training and inference. Researchers can follow it to register their own models.
- Model description standard: field definitions and examples in the STAC MLM extension, plus the paper by Charette-Migneault et al. (2024), GeoSearch '24, doi:10.1145/3681769.3698586.
- Evaluation: the fAIr evaluation guide recommends spatial block splits with a buffer, per-class metrics when the background dominates, and object-level precision, recall and F1 for vector outputs. It notes that pixel intersection over union (IoU) can sit near 98% while ten touching buildings are predicted as one shape. Object-level metrics can be computed with polymetrics.
- Test data: hotosm/vhr-building-segmentation on Hugging Face is the high-resolution imagery set fAIr uses to test building models.
- Post-disaster damage data: HDX's Venezuela earthquake building damage assessment (H3 grid, majority vote) and hotosm/venezuela_eq_2026 on Hugging Face, licensed CC BY-NC-SA 4.0 for non-commercial use. They can be compared with AI predictions, crowd votes and the USGS ShakeMap.
- Tools: MapSwipe, HOT Tasking Manager, OpenAerialMap and fAIr are all open for sign-up.
Sources
- Robin Cole, "Building Open GeoAI for Humanitarian Response", Satellite Image Deep Learning, 2026-10-21 (video)
- HOT, "2026 Venezuela Earthquake Response"
- HOT fAIr documentation, "Activations", "How it works", "Models"
- HOT, "Open Call for Earth Observation GeoAI Models", 2026-07-02
- HDX, "Venezuela M7.5 Earthquake Building Damage Assessment"
- STAC Extensions, "Machine Learning Model (MLM) Extension" v1.6.0, 2026-09-23
Leave a comment
Comments are reviewed before publication. Email is private and used only when contact is necessary. Privacy notice