Every autumn, the UN Environment Programme (UNEP) publishes its Emissions Gap Report, which measures the distance between countries' climate pledges and the temperature goals they signed up to. The 17th edition, released in Nairobi on 21 October 2026, carries the subtitle "The Point of Return". Its central finding is that the chance of holding global warming below 1.5°C with no or limited overshoot is gone. The task now is to keep the overshoot as small and as short as possible and bring temperatures back to 1.5°C by the end of the century. The report also sets out the emission cuts each milestone year would need.
The report now tracks a return to 1.5°C after overshoot
Earlier editions benchmarked progress against scenarios that kept warming below 1.5°C or exceeded it by no more than 0.1°C. This year's report says decades of insufficient action mean a larger exceedance of 1.5°C, measured as a multidecadal average, is now imminent and unavoidable. Every additional fraction of a degree, and every additional year above 1.5°C, raises the risk of irreversible changes in ice sheets, permafrost carbon, ocean circulation and corals.
The report therefore builds a "lowest possible 1.5°C overshoot scenario". It assumes stringent mitigation starting in 2025, limits peak warming around mid-century to 1.7–1.8°C (66% chance), and returns warming to 1.5°C or below by 2100 (50% chance).
Cuts of 18% by 2030, 45% by 2035 and 69% by 2040
To follow that scenario, global greenhouse gas emissions must fall 18% by 2030, 45% by 2035 and 69% by 2040, all relative to 2025. Each figure comes with a range: 15–36% for 2030, 30–60% for 2035 and 60–76% for 2040. Global carbon dioxide (CO₂) emissions would also need to reach net zero around 2050 (range 2046–2058), roughly when temperatures peak.
As an annual rate, that is an average cut of 5.7% a year (range 3.4–8.7%) between 2025 and 2035. The previous benchmark, which started in 2019 and called for a 43% cut below 2019 levels by 2030, required 5.0% a year.
Current pledges deliver 11–15% by 2035
Under the Paris Agreement, countries submit Nationally Determined Contributions (NDCs). As of 1 September 2026, 124 Parties covering about 76% of global emissions had submitted new NDCs, up from 57 Parties covering about 63% at the time of last year's report.
Even if every NDC is fully implemented, global emissions would fall only 5–8% below 2025 levels by 2030, 11–15% by 2035 and 20–27% by 2040. Against the lowest overshoot scenario, that leaves a gap of 5 billion tonnes of CO₂ equivalent (GtCO₂e) in 2030 and 16 GtCO₂e in 2035. The gaps are larger if only unconditional pledges are counted.
Current policies point to 2.8°C by 2100
If current policies continue, the report projects warming of about 2.8°C by 2100 (66% chance), still rising afterwards. Delivering all NDCs would hold it to 2.6°C; adding all net-zero targets brings it to 2.1°C.
All of these figures are higher than last year's. The report gives two reasons: the withdrawal of the United States from the Paris Agreement and upward revisions to historical emissions. New NDCs submitted since last year's report made a negligible difference. It also notes that every five years of CO₂ emissions at current levels pushes peak warming up by around 0.1°C.
Global emissions held almost flat at 58.4 GtCO₂e in 2025
Global greenhouse gas emissions were 58.4 GtCO₂e in 2025 (±5.5), a slight decline of 0.1 GtCO₂e from 2024. The 2024 figure was revised this year, using a new method, from 57.7 to 58.5 GtCO₂e. Emissions grew by an average of 0.8% a year over the past decade, compared with 1.7% a year between 1990 and 2016.
Fossil CO₂, nitrous oxide and fluorinated gases all rose in 2025, while methane held steady. The small overall decline came from land use, land-use change and forestry (LULUCF), where emissions fell by about 0.5 GtCO₂e, mainly because of lower global wildfire emissions. The Group of Twenty (G20, excluding the African Union) accounts for 76% of global emissions, and its combined emissions rose 0.7% in 2025. Some 63 countries cut their emissions, by 1.8 GtCO₂e in total, while 124 countries increased theirs, by 7.2 GtCO₂e.
About 320 GtCO₂ must be removed and permanently stored this century
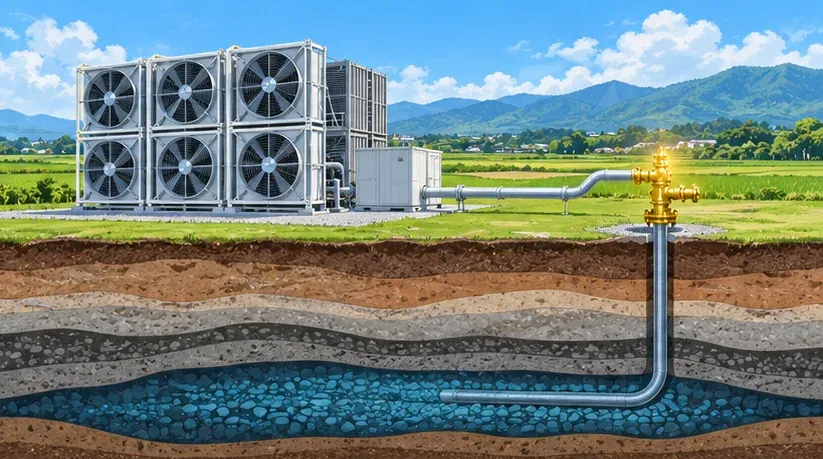
Bringing temperatures down from a peak takes more than emission cuts; CO₂ already in the atmosphere has to be taken back out. The report estimates that the lowest overshoot scenario requires removing and permanently storing roughly 320 GtCO₂ over this century, equal to about eight years of 2024's CO₂ emissions. In the main text, the report estimates that each 0.1°C of cooling takes about 220 GtCO₂ of removal (likely range 160–370 GtCO₂).
The report is candid that socioeconomic and technological challenges make this scale uncertain. Carbon dioxide removal (CDR) depends on long-term, secure carbon storage. For the state of carbon capture and storage (CCS) projects, see ccs.tw's earlier analysis of the 2026 Global Status of CCS report.
Renewable capacity has grown three times faster than expected
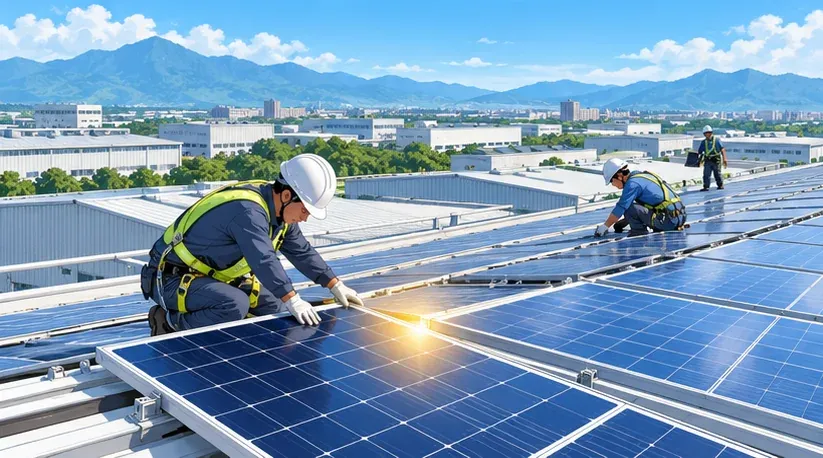
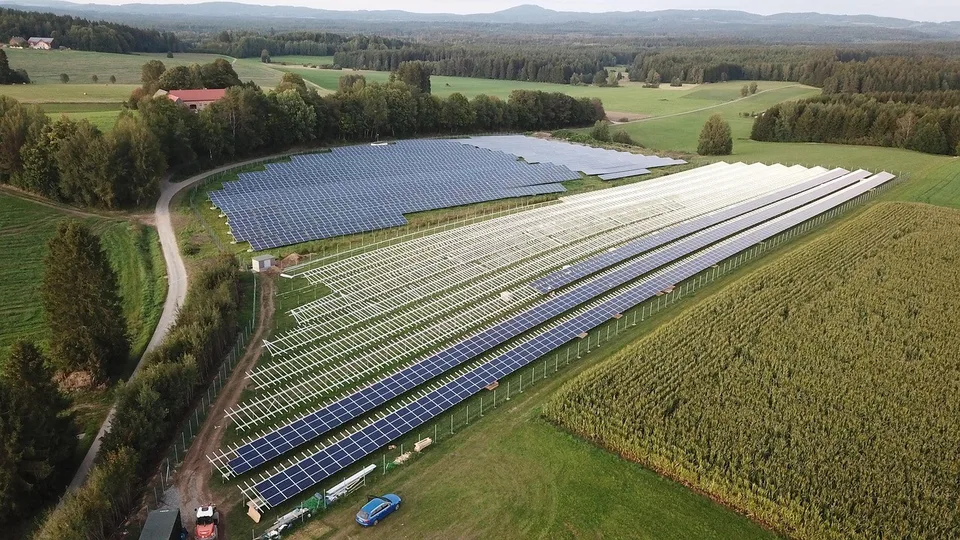
The report also records progress. Since the Paris Agreement was adopted, global renewable electricity capacity has grown three times faster than anticipated, and solar photovoltaics (PV) seven times faster. If these trends continue with additional policy support, the world would be on track to triple renewable capacity by 2030. Total energy supply from coal and oil has also grown more slowly than projected.
The laggards are fossil fuels and deforestation. Indicators that track absolute emissions, including energy-system CO₂, road transport and non-CO₂ gases such as methane, have recently been moving in the wrong direction.
Sector benchmarks for 2035 and 2040
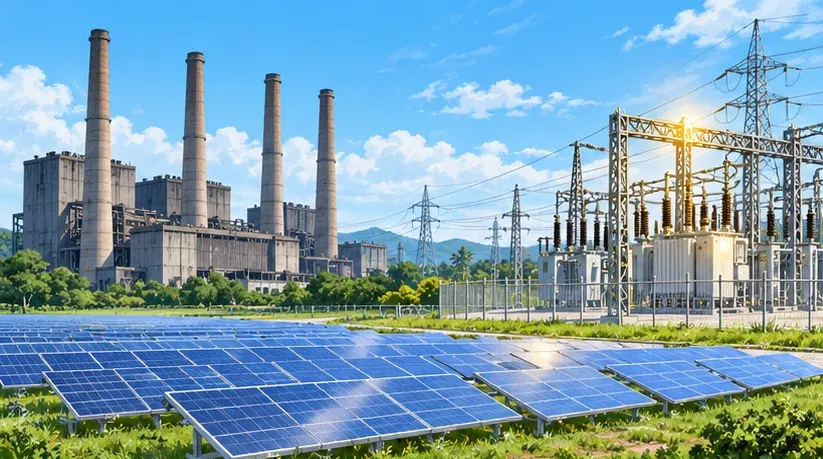
The first Global Stocktake (GST) set goals for 2030, including tripling renewable capacity, doubling the annual rate of energy-efficiency improvement and transitioning away from fossil fuels in energy systems. The report suggests the second GST extend these goals to 2035 and 2040, and calculates benchmarks consistent with the lowest overshoot scenario (all relative to 2025):
- Renewable electricity capacity: tripled by 2035 and at least 4.5 times by 2040.
- Primary energy intensity of gross domestic product (GDP): at least 30% lower by 2035 and at least 40% lower by 2040.
- Shares of coal, oil and gas in total energy supply: at least 55%, 15% and 5% lower by 2035, and at least 75%, 30% and 35% lower by 2040.
- Coal-fired electricity generation: at least 75% lower by 2035 and effectively phased out globally by 2040.
- Methane emissions: at least 25% lower by 2035 and at least 40% lower by 2040.
As starting points, the report puts 2025 global renewable capacity at about 5,100 GW, with wind and solar generating about 5,400 TWh, or 17% of electricity.
More than 220 evaluations show carbon pricing cut emissions 5–13%
The report draws on more than 220 policy evaluations that provide causal evidence that climate policies reduce emissions. Evaluated electricity-sector policies cut emissions by 9% on average, and economic instruments such as cap-and-trade schemes and carbon taxes delivered average reductions of 5–13% across sectors. The evaluations also identify 63 structural shifts, in developed and developing countries alike, where emissions fell by more than 5% after climate policies were introduced or strengthened.
The report notes the limits of this evidence. Successes are concentrated in particular sectors, countries and periods; fewer than a third of existing carbon-pricing schemes have been evaluated, and the studies cluster in Europe, North America and China. Reaching the lowest overshoot pathway means scaling effective policies across whole economies and worldwide, combined into policy mixes suited to each country's priorities and conditions.
Possible directions for Taiwan

Taiwan's emissions are already on a downward path. According to the national greenhouse gas inventory published by the Ministry of Environment in June 2026, Taiwan's net emissions in 2024 were 251.404 million tonnes of CO₂e, 6.59% below the 2005 base year and 1.92% below 2023, the third consecutive annual decline. Between 2005 and 2024, real GDP grew 93.13% while CO₂ emission intensity fell 48.59%, and energy-sector emissions in 2024 dropped below the base year for the first time. Taiwan's NDC 3.0, announced in November 2025, targets a 38%±2% cut from 2005 levels by 2035, and net zero by 2050 is written into law.
Several directions line up with the report's evidence:
- Evaluate the first year of the carbon fee: Taiwan's carbon fee applies to emissions from 2025 at a standard rate of NT$300 per tonne, with the first payments due from May 2026 based on 2025 emissions. Since carbon-pricing evaluations cluster in Europe, North America and China, Taiwan's reporting and reduction data could become a rare Asian case study. For the design of the carbon fee and an emissions trading system (ETS), see ccs.tw's analysis of Taiwan's carbon fee and ETS.
- Keep renewables growing: according to the Energy Administration of the Ministry of Economic Affairs, renewables supplied 13.32% of Taiwan's electricity in 2025, including 5.78% from solar PV and 4.21% from wind. The global benchmark of tripling capacity by 2035 offers a useful timescale for reviewing Taiwan's own build-out.
- Plan early for removal and storage: with the report estimating about 320 GtCO₂ of removal and permanent storage this century, Taiwan can assess, alongside emission cuts, which emission sources suit carbon capture and which geological formations suit carbon storage, so that carbon capture and storage has a defined place in the mitigation mix.
Sources
- UNEP press release, New UNEP report lays out emission cuts needed to return to 1.5°C, 2026-10-21: https://www.unep.org/en/news-and-stories/press-release/new-unep-report-lays-out-emission-cuts-needed-return-15degc
- UNEP, Emissions Gap Report 2026: The Point of Return (report page): https://www.unep.org/en/publications/report/emissions-gap-report-2026
- UNEP, Emissions Gap Report 2026 full report and executive summary (DOI): https://doi.org/10.59117/20.500.11822/50038
- Ministry of Environment (Taiwan), 2026 national greenhouse gas inventory press release, 2026-06-03 (Chinese): https://enews.moenv.gov.tw/moenv-news/zh-tw/News/1631
- Ministry of Environment (Taiwan), NDC 3.0 press release, 2025-11-07: https://www.moenv.gov.tw/en/news/press-releases/34357.html
- Ministry of Environment (Taiwan), Fee-Charging Rates of Carbon Fees: https://www.moenv.gov.tw/en/news/press-releases/31552.html
- Energy Administration, Ministry of Economic Affairs, 2025 Energy Statistics Handbook: https://ea01.moeaea.gov.tw/a0303/02/attachments/handbook/2025/2025EnergyStaHandBook.pdf
Leave a comment
Comments are reviewed before publication. Email is private and used only when contact is necessary. Privacy notice